Project KPI dashboard template
Download a free project KPI dashboard template with example delivery metrics, status rules, owner fields, and a weekly reporting structure for project teams.
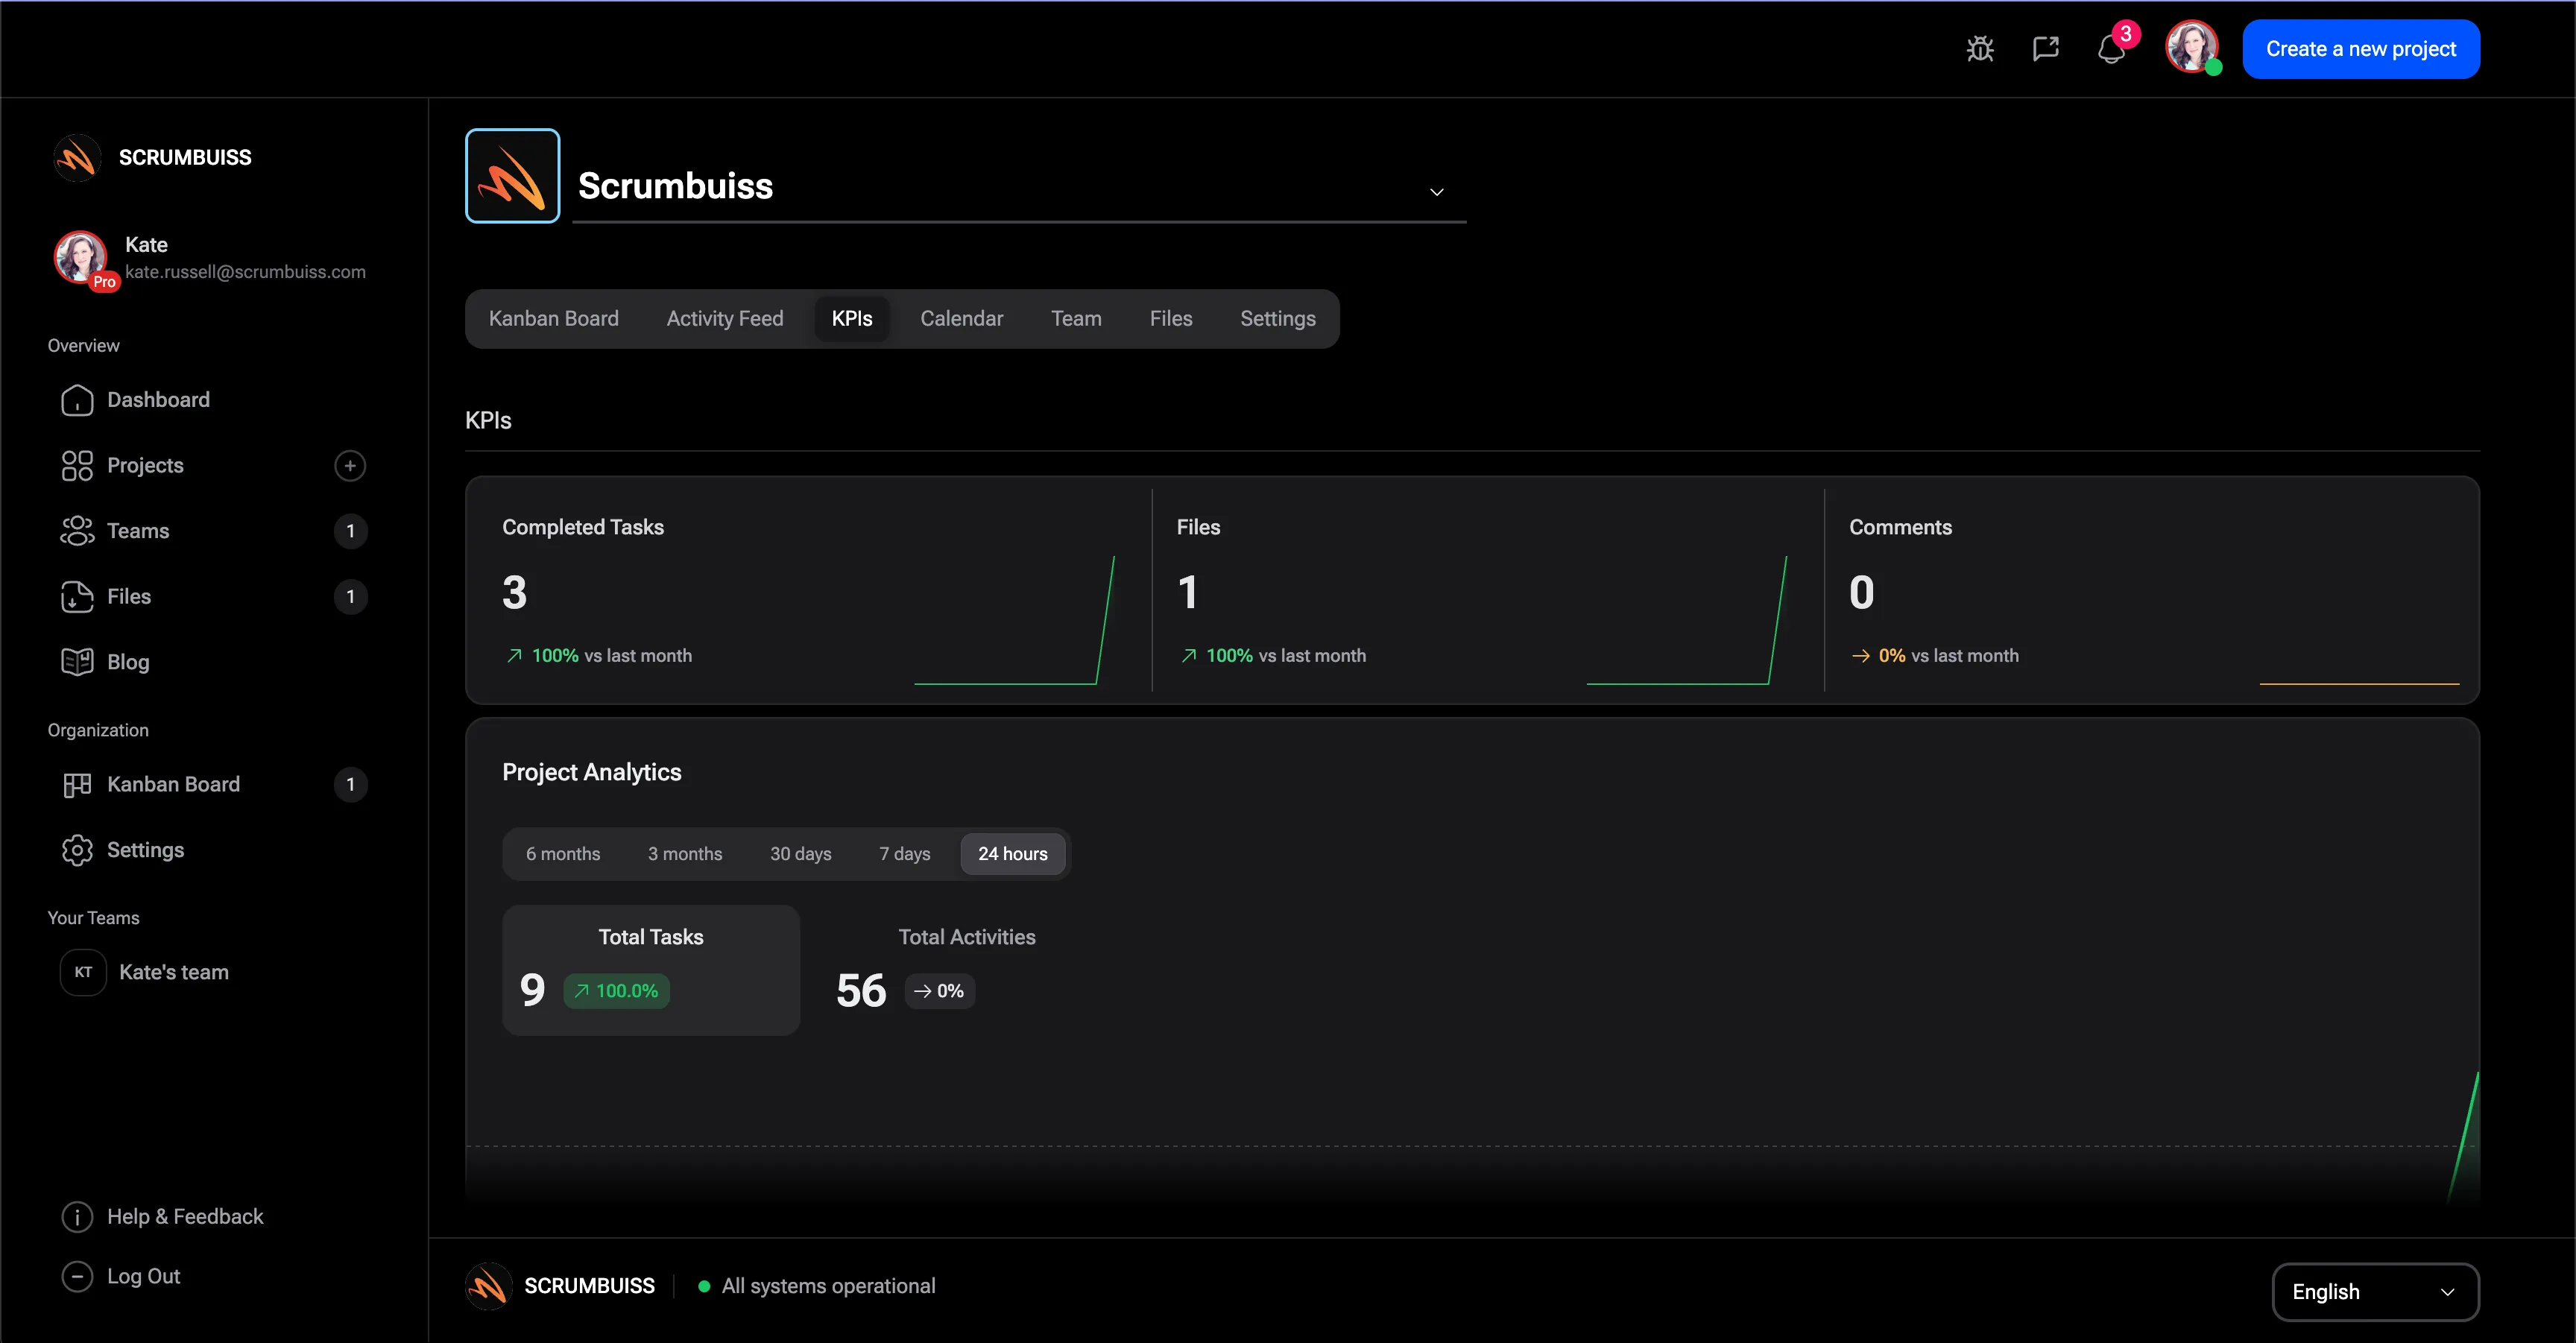
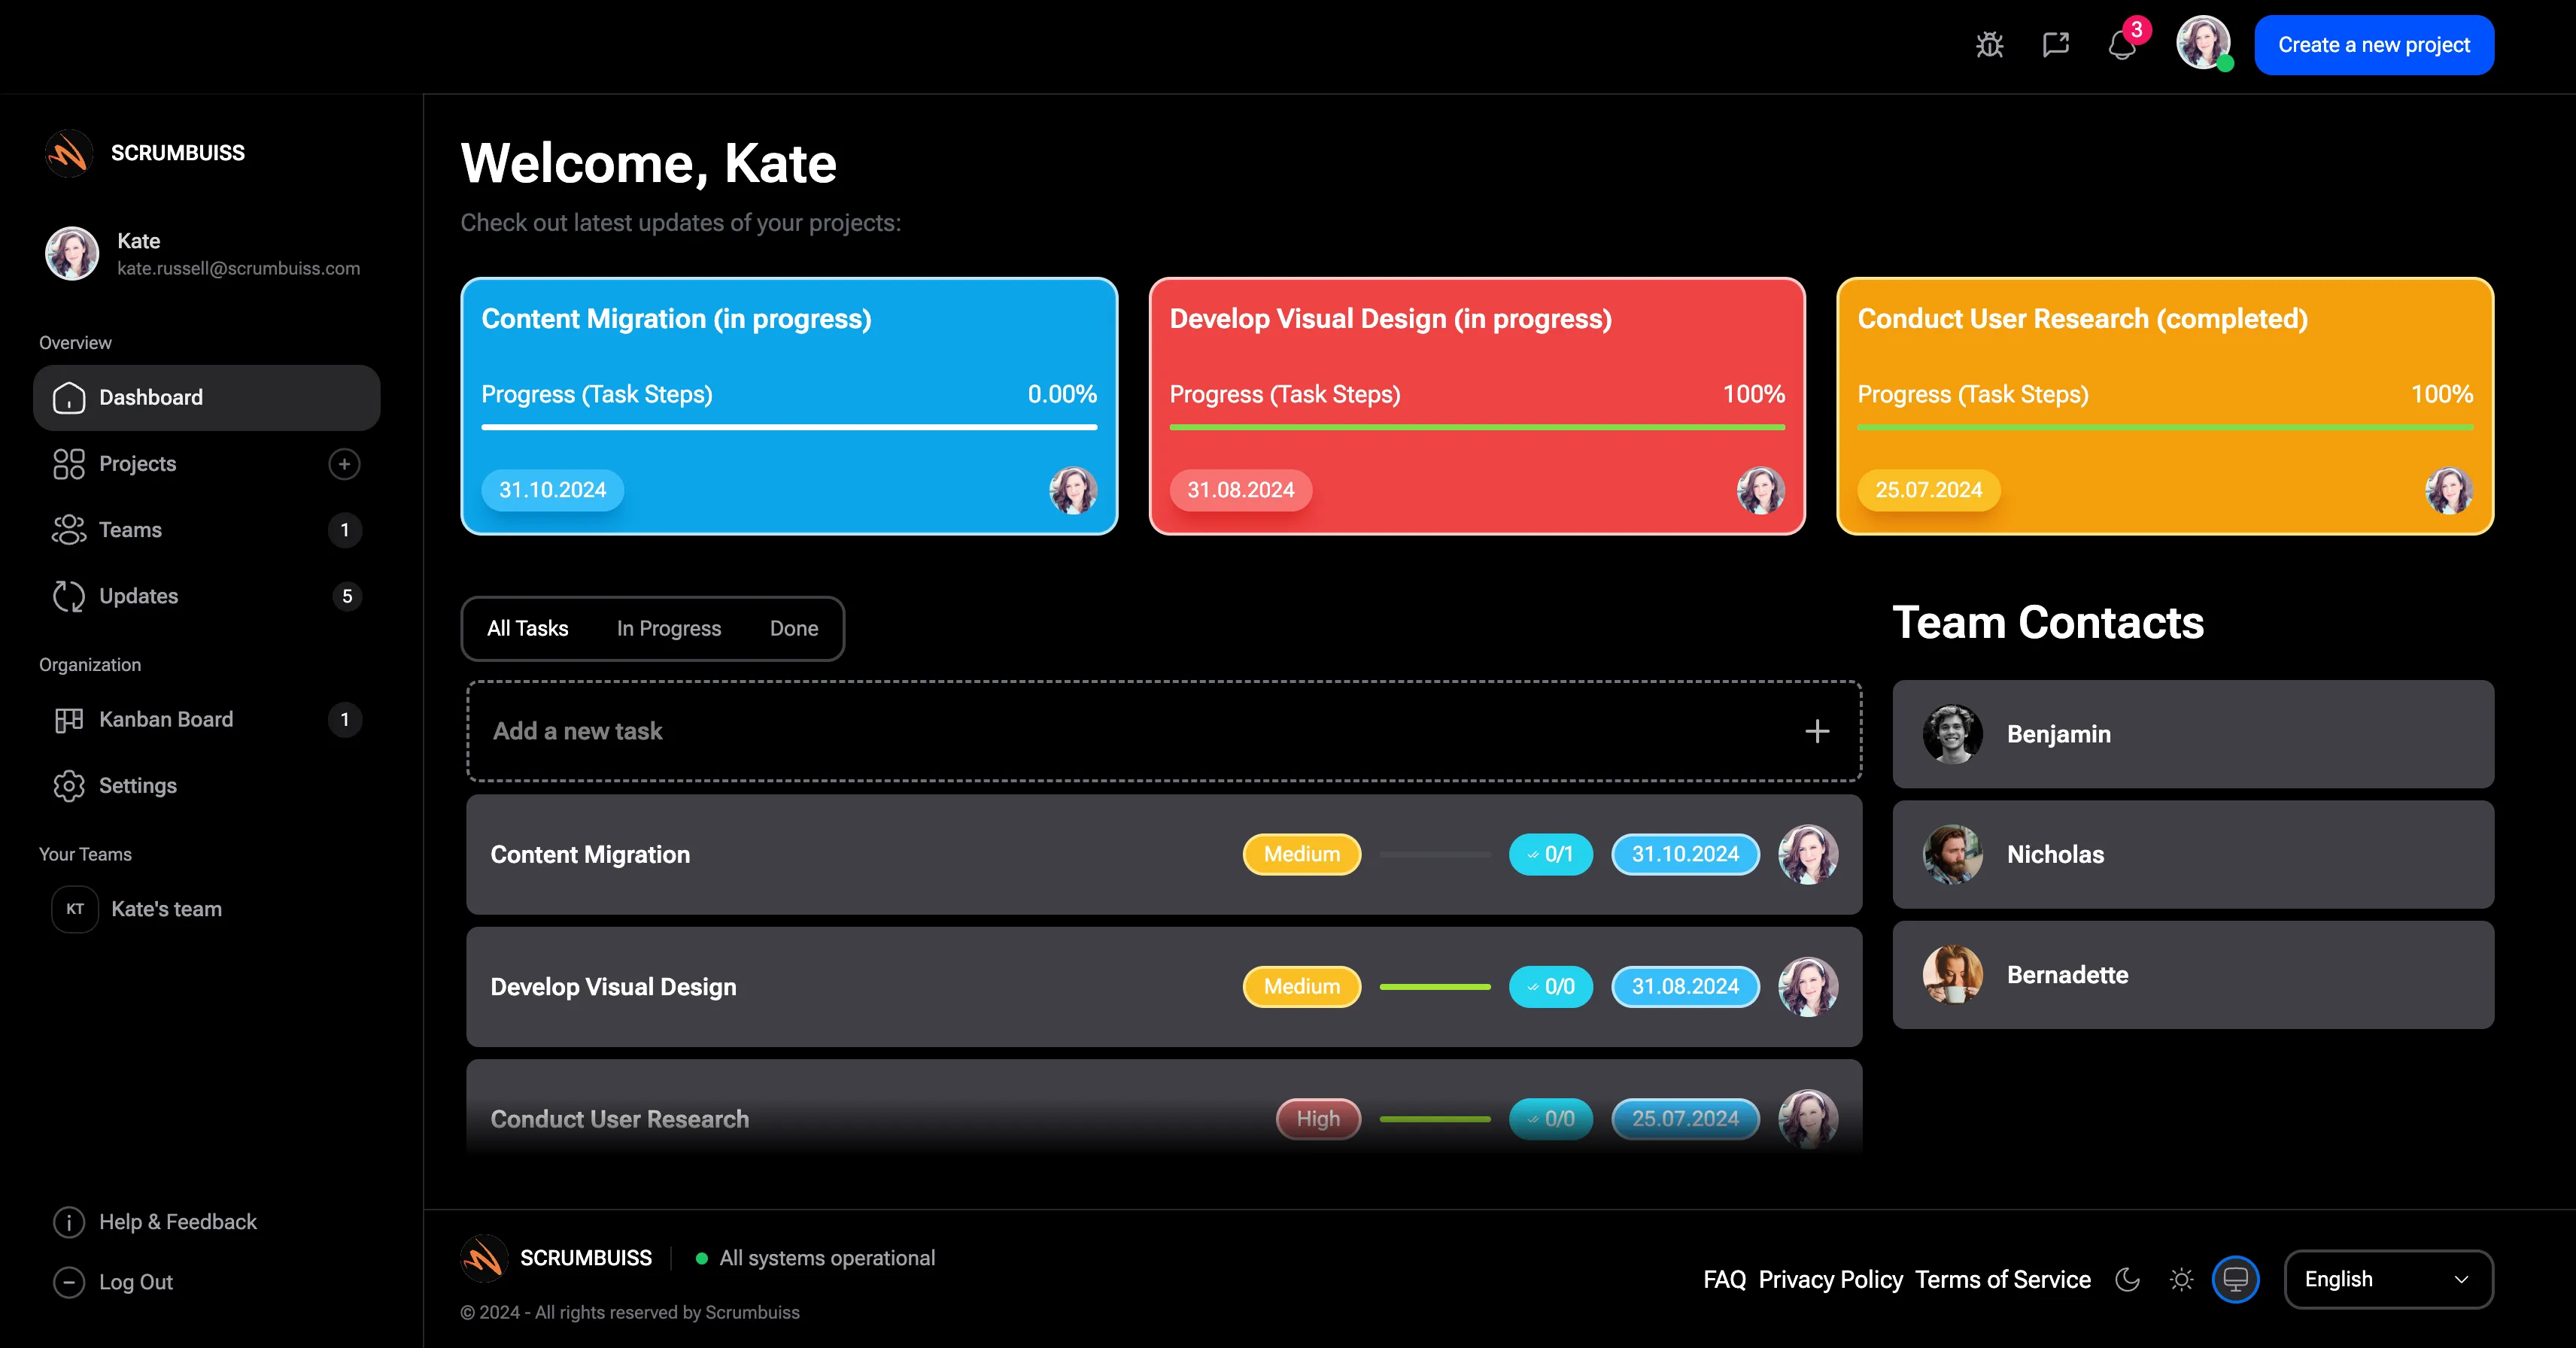
Use this project KPI dashboard template to choose the metrics that deserve a weekly review, then connect the same reporting rhythm to dashboards, workload, risks, and timelines in Scrumbuiss.
What this project KPI dashboard template helps you do
Use these checkpoints to build a dashboard that supports project decisions, not just metric collection.
- ✓ Project KPI dashboard structure for delivery, workload, risk, schedule, and stakeholder reporting
- ✓ Filled example metrics for progress, blocked work, overdue tasks, workload pressure, and risk exposure
- ✓ Status rules that make KPI reviews easier to run without turning the dashboard into vanity reporting
- ✓ CSV format you can open in Excel or Google Sheets before moving the same reporting rhythm into Scrumbuiss
When to use this template
A KPI dashboard template is most useful when the team needs one reporting structure for progress, risk, capacity, and stakeholder updates.
- Use it when a project review needs a small number of decision-ready KPIs instead of a long status deck.
- Use it when stakeholders keep asking for progress, risk, capacity, or deadline updates in different formats.
- Use it when the team already has task data but needs a clearer dashboard structure for weekly reporting.
- Use it before building a live dashboard so everyone agrees which metrics are useful enough to track.
What is inside the KPI dashboard template
The CSV keeps each metric tied to a target, owner, review cadence, source, status rule, and next decision.
What to include in a project KPI dashboard
The best project dashboards combine progress, schedule, workload, risk, and decision ownership in one readable view.
Outcome metric
Include at least one KPI tied to the project outcome, such as launch readiness, accepted scope, customer impact, or delivery confidence.
Delivery progress metric
Track progress with a metric the team can explain, such as completed milestones, accepted work, or sprint commitment progress.
Schedule or timeline signal
Show whether the plan is on track, drifting, or blocked so stakeholders can understand date risk before the deadline moves.
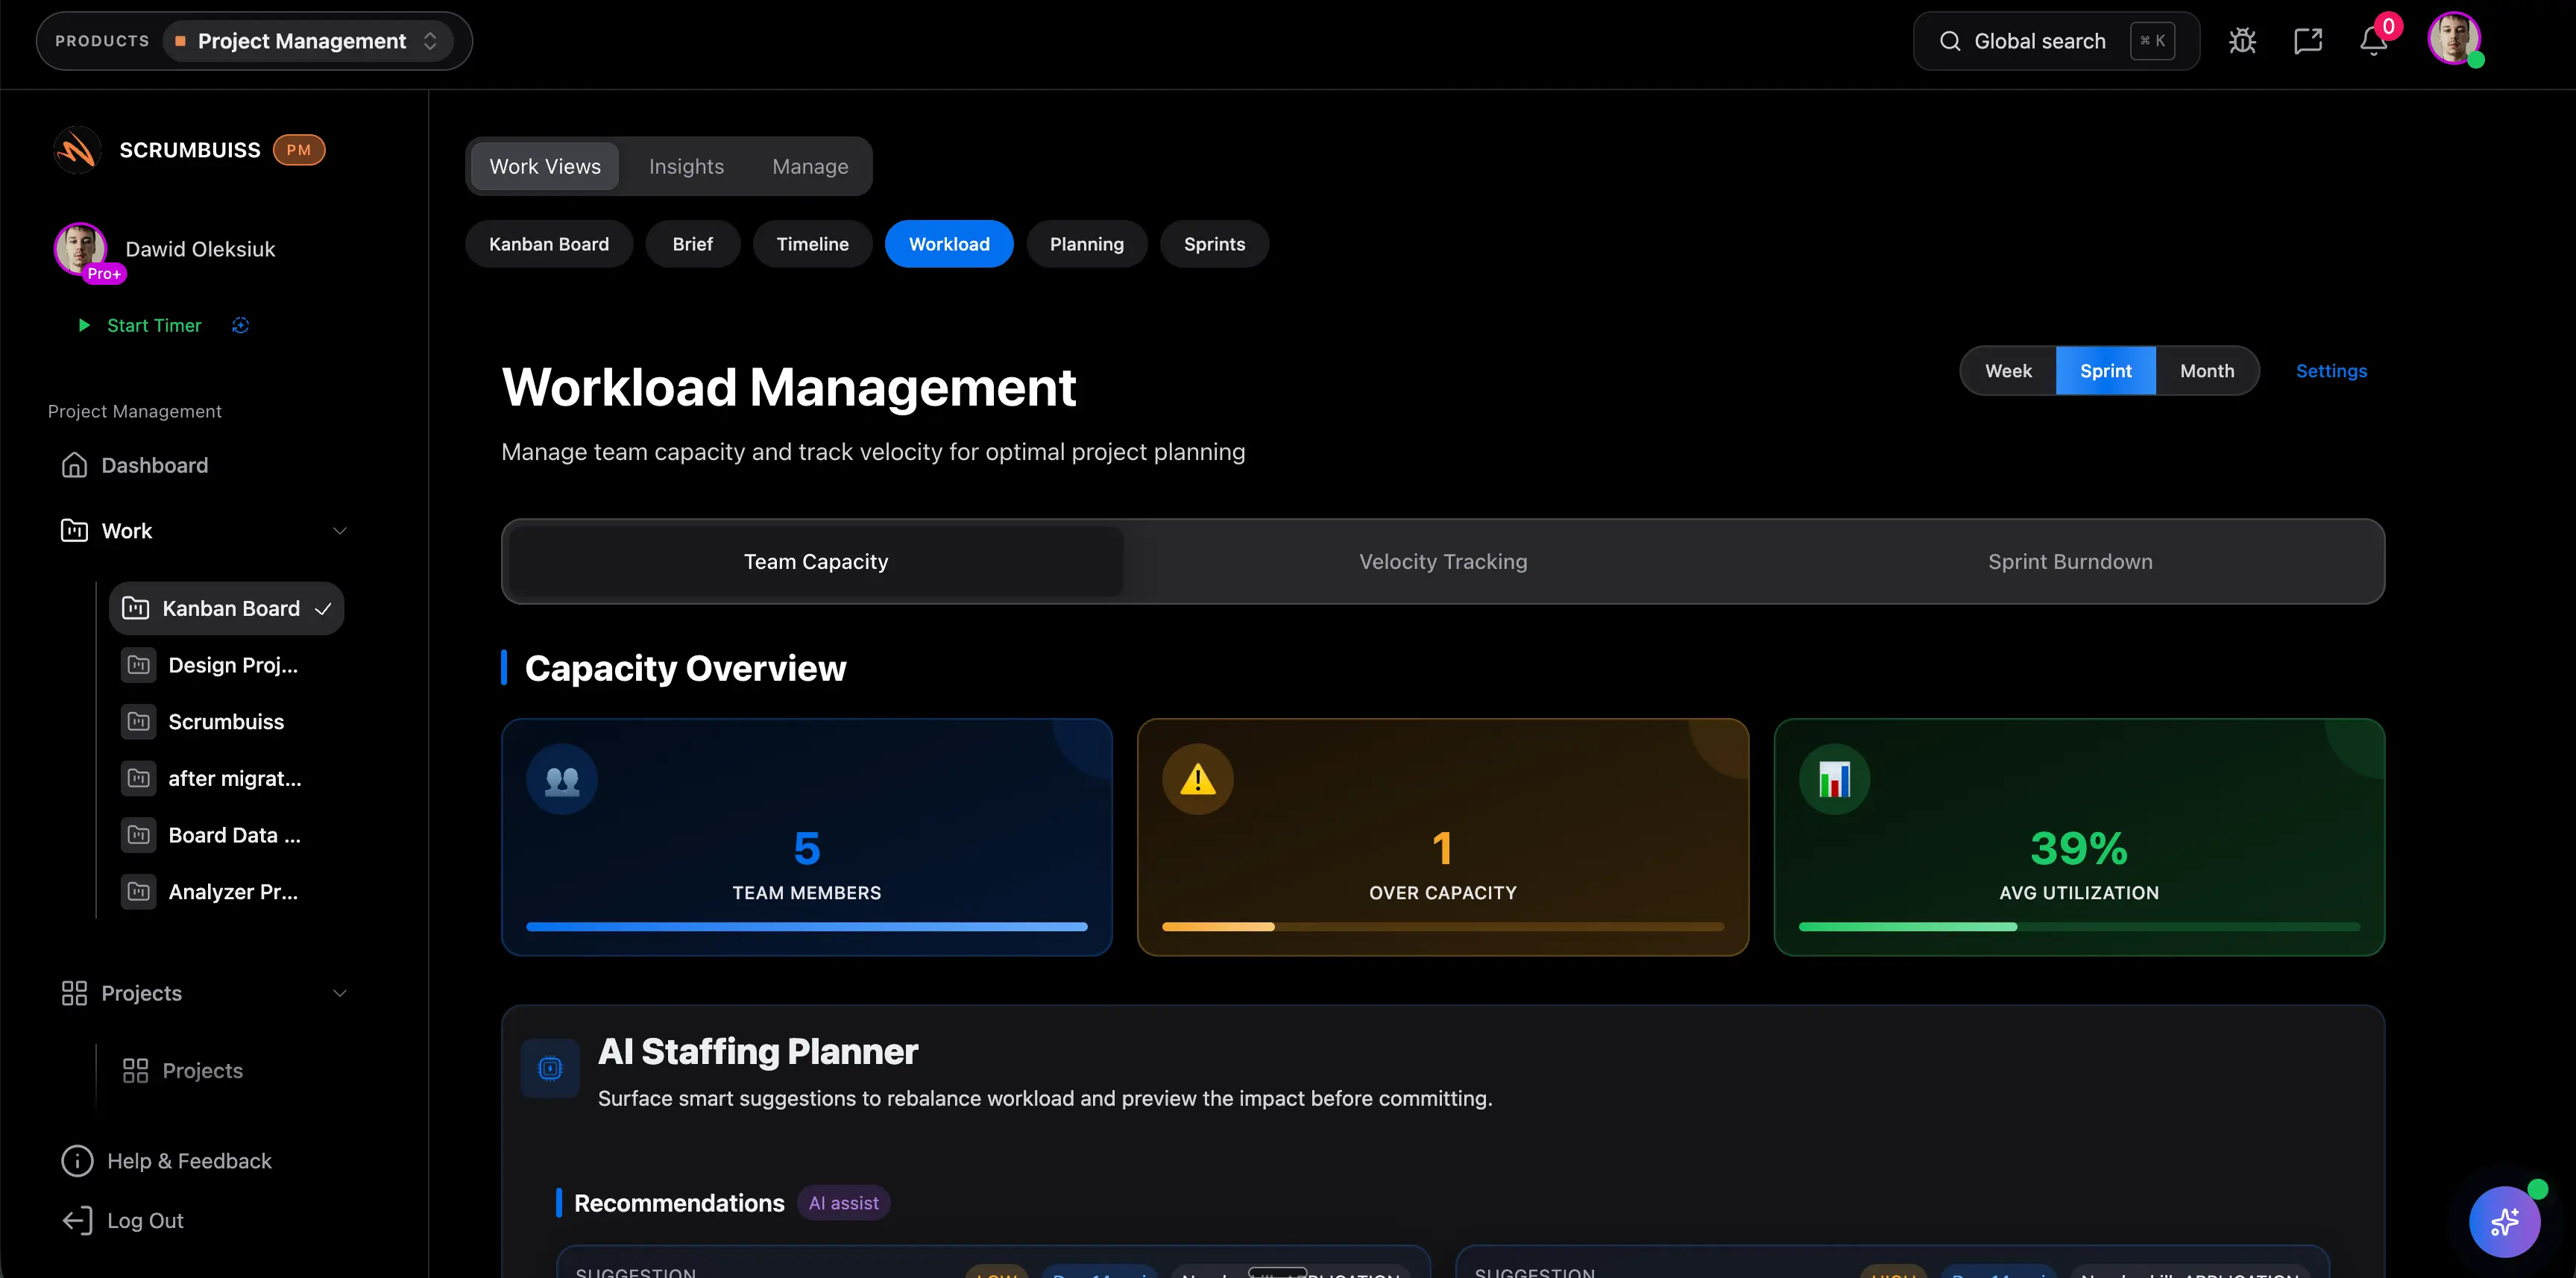
Workload or capacity signal
Use a simple workload indicator so teams can see whether the plan depends on overloaded owners or unrealistic availability.
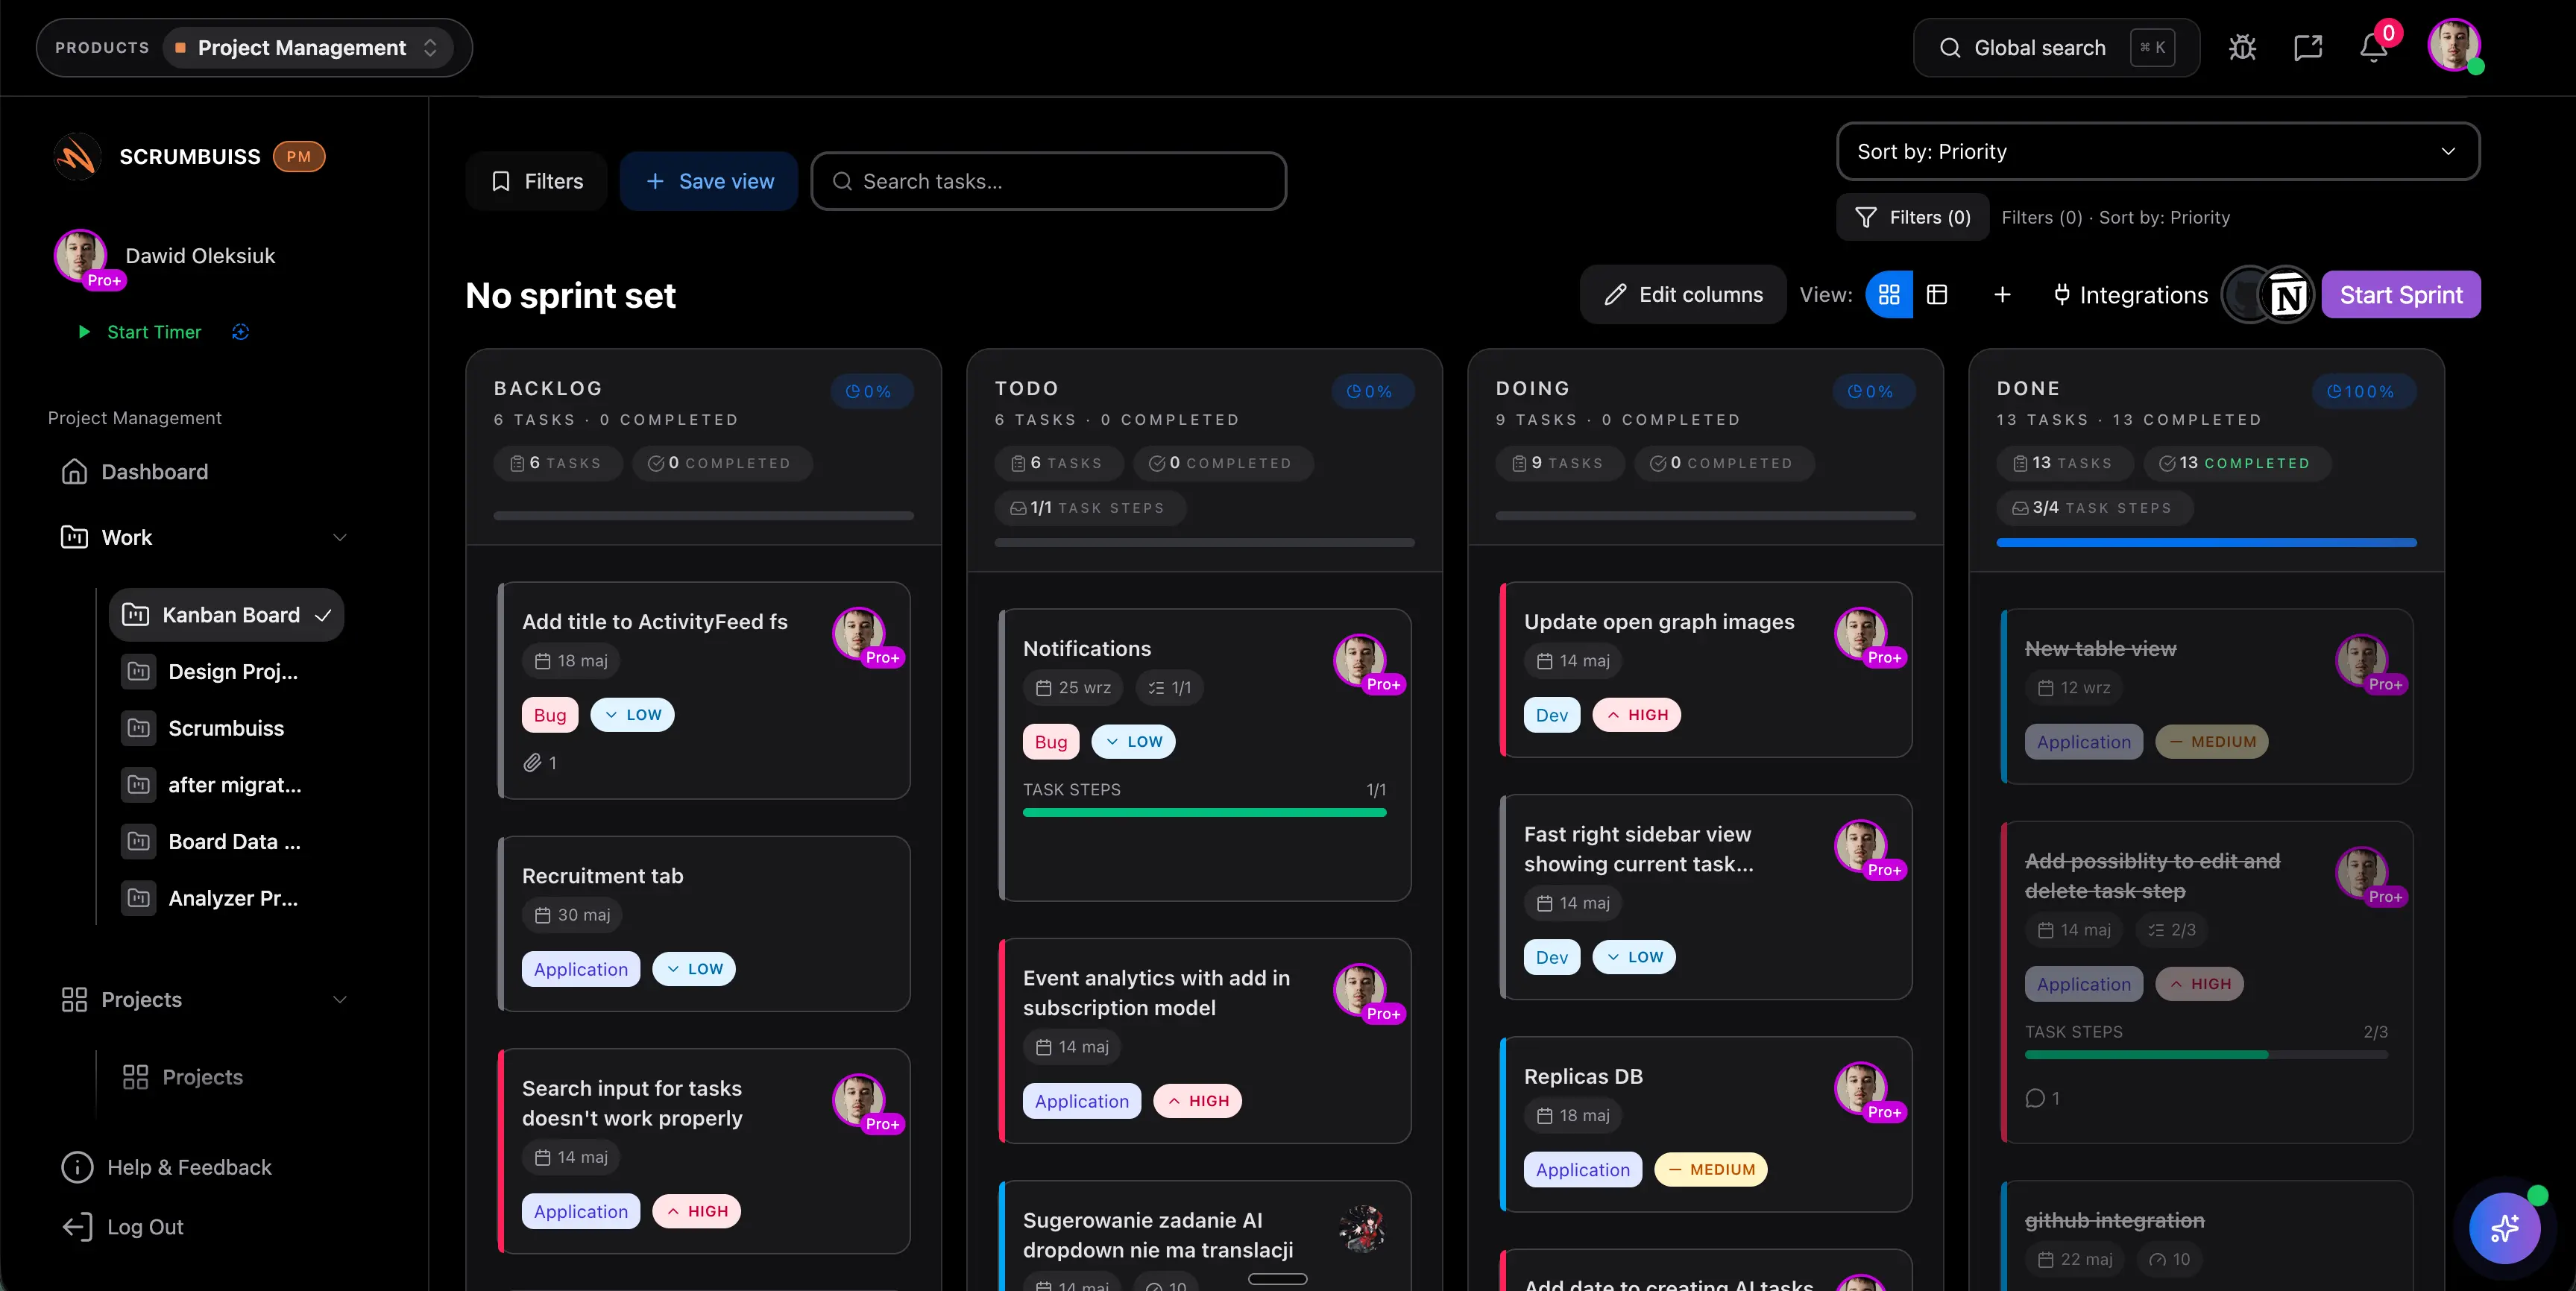
Risk and blocker signal
Keep active risks, blockers, and mitigation follow-ups close to the dashboard so reporting drives action.
Owner and next decision
Name the person responsible for each KPI and write the next decision or follow-up needed when the status changes.
Project KPI dashboard examples
Use these examples as a starting point, then keep only the KPIs that match your project workflow and stakeholder needs.
Delivery confidence
Green when milestone progress is within 5% of the plan, amber when one milestone is at risk, and red when the next launch date needs a decision.
Blocked work
Tracks the count of blocked tasks and highlights the oldest blocker so the team can resolve stuck handoffs during the review.
Workload pressure
Compares active work against team capacity so the dashboard shows whether the current plan is realistic for the week.
Risk exposure
Summarizes high-priority open risks and mitigation ownership instead of hiding risk review in a separate spreadsheet.
Stakeholder update
A short plain-language status summary that explains what changed, what needs attention, and which decision comes next.
Data source
Records where each KPI comes from so the dashboard can be audited and updated without guessing.
KPI dashboard review checklist
Run this checklist before using the dashboard in a stakeholder review or recurring delivery meeting.
- Limit the first dashboard to the KPIs that change a decision in the weekly project review.
- Define the target and status rule for every metric before stakeholders start reading the dashboard.
- Use one owner per KPI so missing or stale data has a clear follow-up path.
- Separate project health metrics from team performance metrics so reporting does not create the wrong incentives.
- Review red or amber statuses with the related risk, workload, or timeline context before changing the plan.
- Archive KPIs that no longer affect decisions so the dashboard stays short enough to use.
Common KPI dashboard mistakes
These are the patterns that usually make project KPI dashboards noisy, stale, or disconnected from real decisions.
- Tracking too many KPIs until the dashboard becomes a report nobody uses to make decisions.
- Using vague status labels without thresholds, which makes every weekly review depend on opinion.
- Copying generic KPI examples that do not match the project workflow, audience, or delivery risk.
- Showing progress without blockers, workload, or risk context, which can make the project look healthier than it is.
- Refreshing the dashboard manually while the real project data lives somewhere else.
How to use this KPI dashboard template
Start in the CSV, agree on thresholds, and move into Scrumbuiss when the dashboard needs live project context.
Choose KPIs that change a decision
Start with a small set of progress, schedule, workload, and risk metrics that help the team decide what to do next.
Set thresholds and ownership
Define green, amber, and red rules for each KPI, then name the owner who updates the metric and acts when it changes.
Review the dashboard with delivery context
Use the dashboard alongside workload, timeline, and risk review so status changes lead to concrete follow-up work.
Related reporting workflows
Use these Scrumbuiss pages when the template needs live data, workload context, risk review, and timeline visibility.
Recommended workflows
These workflows use project KPIs when teams need to turn reporting into weekly delivery decisions.
Software teams
Use caseProject management software for software teams that keeps sprint planning, dependencies, GitHub-adjacent delivery visibility, and stakeholder reporting in one workflow.
Client project management
Use caseClient project management software for agencies that keeps intake, briefs, files, approvals, time tracking, workload, and client-visible status in one workflow.
Agencies
Use caseProject management software for agencies that keeps time tracking, files, workload visibility, and reporting in one workflow.
Need more ideas? Browse use cases .
Project KPI dashboard template FAQ
What is a project KPI dashboard template? +
A project KPI dashboard template is a reusable structure for tracking the project metrics that matter during recurring reviews. It usually includes the metric name, category, target, current value, status rule, owner, source, trend, and follow-up decision.
Which KPIs should a project dashboard include? +
Start with a balanced set: delivery progress, schedule health, workload or capacity pressure, open blockers, risk exposure, and stakeholder-ready status. Add financial or quality metrics only when they affect the decisions your project team actually makes.
What is the difference between KPI examples and a KPI dashboard template? +
KPI examples give you ideas for metrics. A KPI dashboard template turns those metrics into a working review format with owners, thresholds, source fields, and follow-up prompts.
Can I use this KPI dashboard template in Excel or Google Sheets? +
Yes. The downloadable CSV opens in Excel, Google Sheets, and most spreadsheet tools. It is useful as a lightweight starting point before the same metrics move into a live project dashboard.
When should we move from a spreadsheet KPI dashboard to software? +
Move beyond a spreadsheet when the dashboard depends on live project status, recurring owner updates, workload changes, risk reviews, or stakeholder reporting that should not be rebuilt manually every week.