Gantt Chart in Project Management
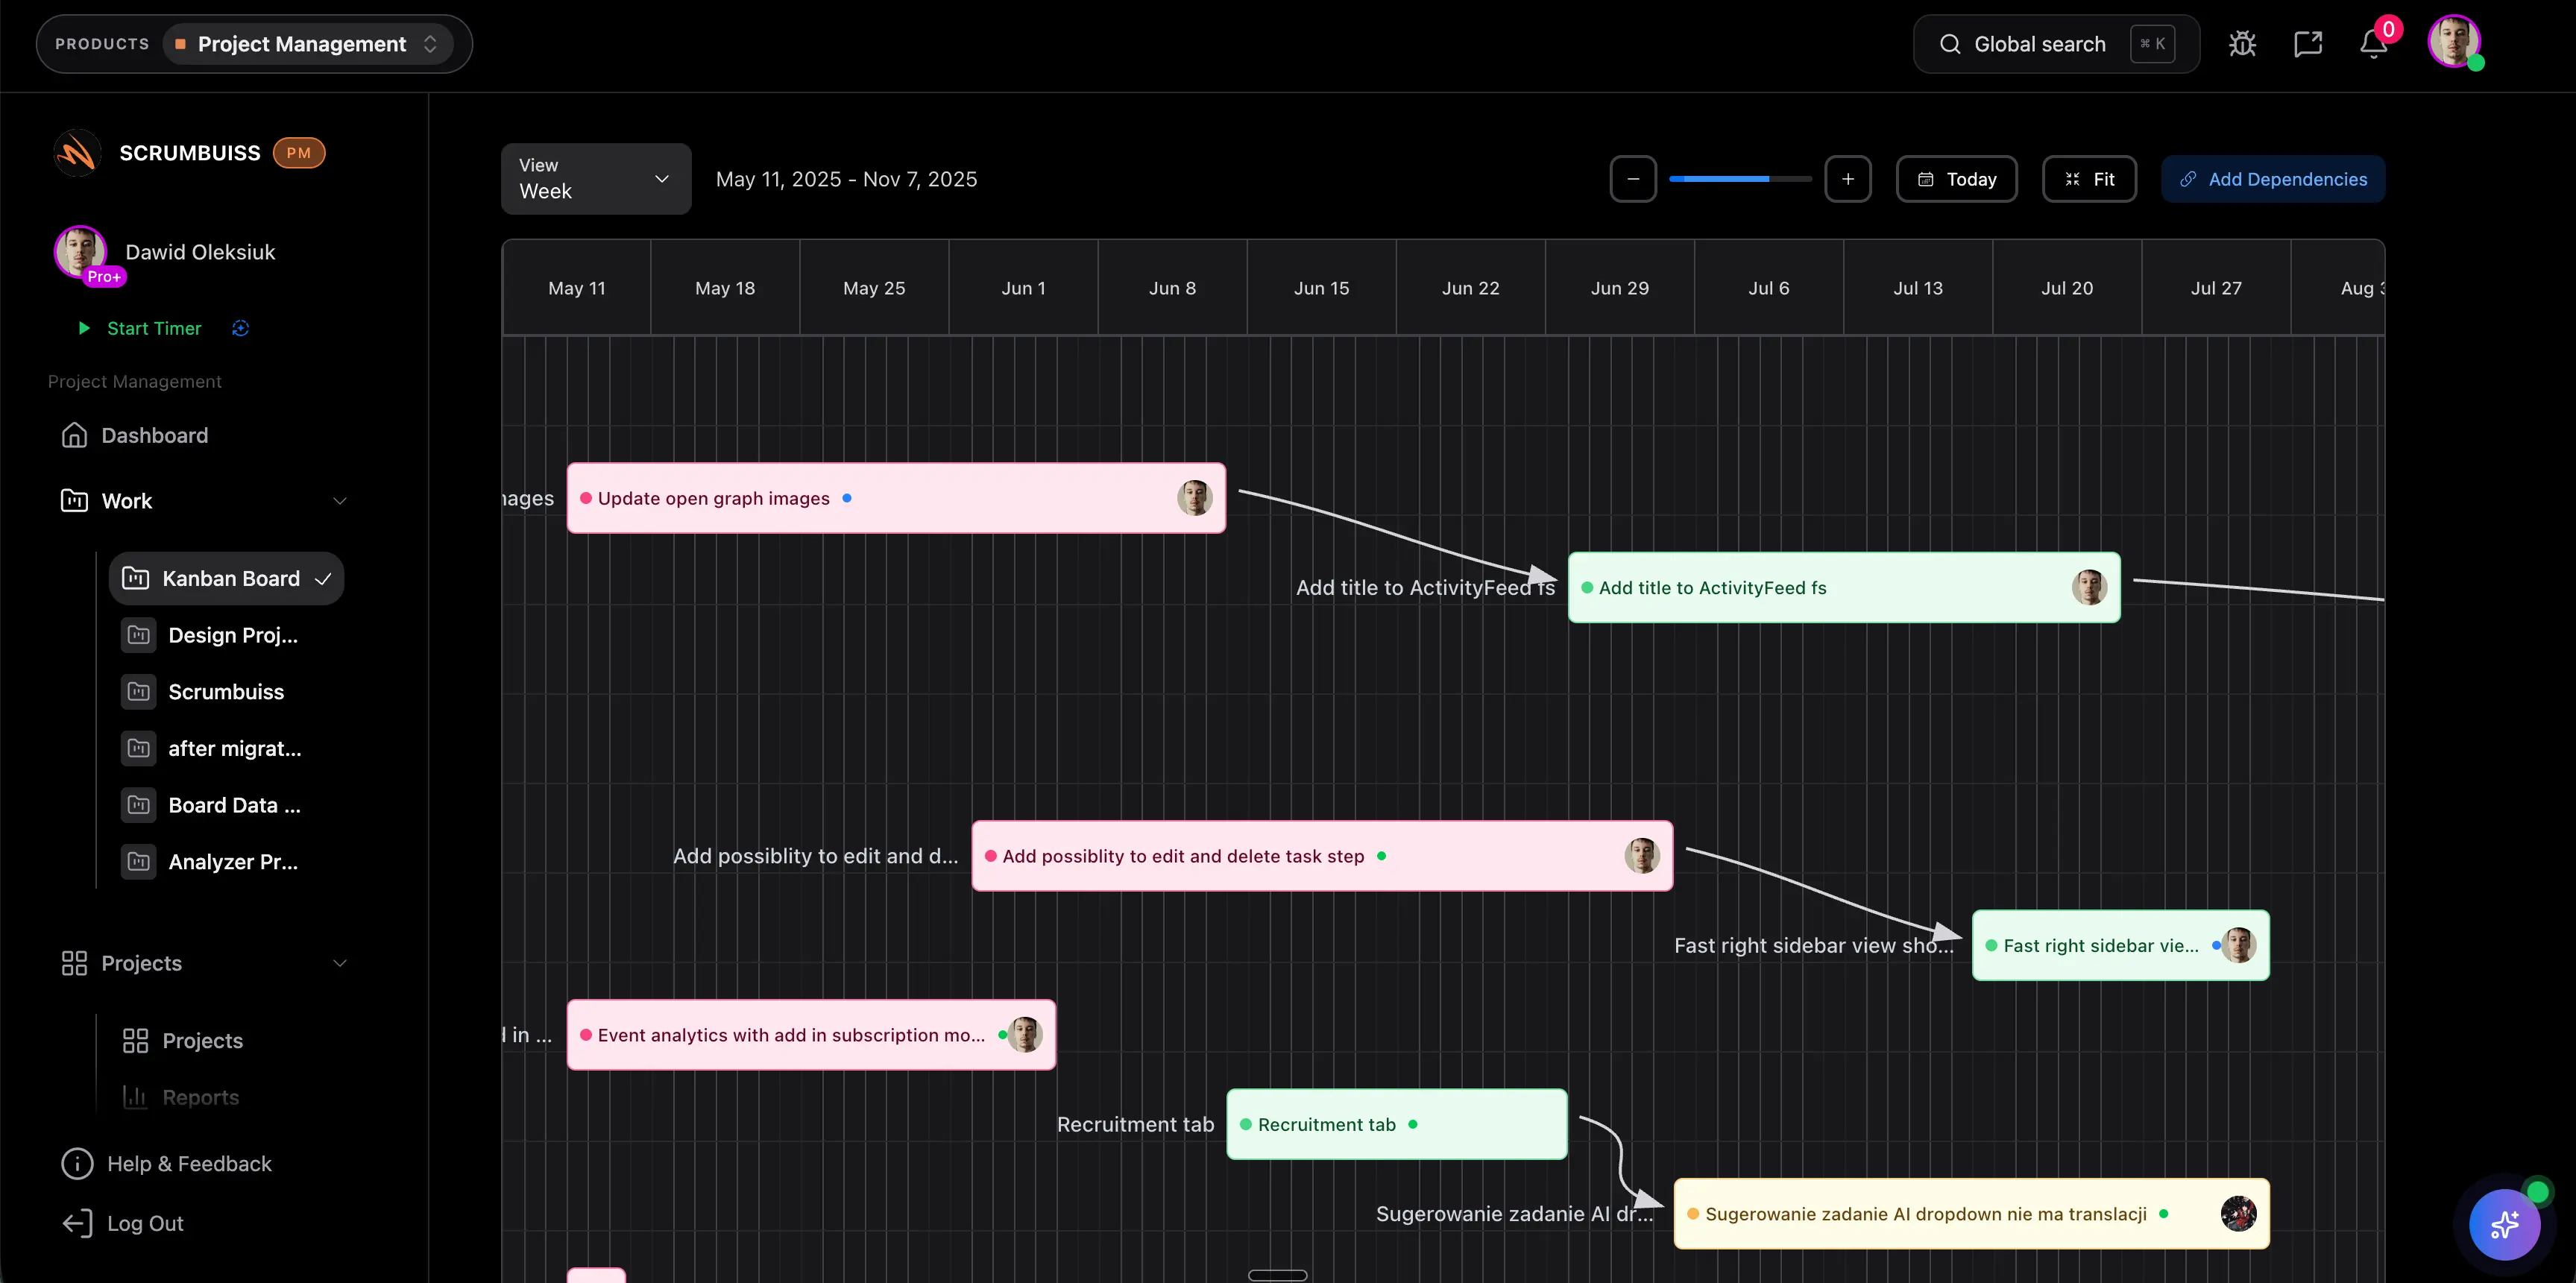
A Gantt chart in project management is a timeline view that shows tasks, owners, dates, dependencies, and milestones across the project schedule. It helps teams see when work starts, when it finishes, and how one delay can affect later work.
This guide targets the Gantt chart project management keyword cluster found in SEMrush. It supports the broader project scheduling software guide and the Scrumbuiss Gantt Timeline page without duplicating either one.
Key Takeaways
- A Gantt chart is best for schedule visibility, dependency review, milestone planning, and stakeholder conversations.
- The chart is only useful when tasks have clear owners, realistic dates, and visible dependency logic.
- Gantt charts should complement task boards and dashboards, not replace every project view.
- Teams should review Gantt timelines whenever scope, capacity, or dependencies change.
What Is a Gantt Chart in Project Management?
A Gantt chart is a horizontal timeline that maps project work against calendar time. Each task appears as a bar. The length of the bar shows duration, while its position shows when the task should start and finish.
Most project teams use Gantt charts to answer questions like:
- What work happens first?
- Which tasks overlap?
- Which milestone is at risk?
- What dependency could delay the next phase?
- Who owns each major workstream?
- What changed since the last schedule review?
What To Include in a Gantt Chart
| Element | Why it matters |
|---|---|
| Task name | Defines the work being scheduled |
| Owner | Makes accountability visible |
| Start and finish dates | Shows when work is expected to happen |
| Duration | Helps estimate timeline pressure |
| Dependencies | Shows which tasks must finish before others begin |
| Milestones | Marks important stakeholder commitments |
| Status | Shows whether scheduled work is planned, active, blocked, or complete |
| Baseline or change note | Explains how the current plan differs from the approved plan |
A Gantt chart without owners or dependencies is usually just a date list. A useful chart makes coordination risk visible.
Gantt Chart vs. Project Timeline
| View | Best use | Main limit |
|---|---|---|
| Gantt chart | Detailed schedule planning with task bars, owners, dependencies, and milestones | Can become too dense for executives or clients |
| Project timeline | High-level sequence of phases, milestones, and major deliverables | May not show enough task-level dependency detail |
| Task board | Daily execution and handoffs | Weak at showing date impact and dependency chains |
| Dashboard | Reporting project health, workload, and risk | Does not replace detailed schedule planning |
Use the project timeline guide when you need a broader planning explanation. Use this guide when the specific question is how Gantt charts help manage a schedule.
When To Use a Gantt Chart
Gantt charts are useful when:
- the project has dependencies between teams or workstreams
- milestones must be reported to leaders, clients, or sponsors
- date changes need to be explained clearly
- a task board no longer shows schedule risk
- capacity pressure could make the planned dates unrealistic
- the project has phases, reviews, approvals, or handoffs
They may be excessive for very small projects with flexible dates and few dependencies.
How To Create a Gantt Chart
- Define the project outcome and major deliverables.
- Break work into tasks or work packages.
- Add owners for each task.
- Estimate duration using real team capacity, not ideal availability.
- Add dependencies before committing dates.
- Mark milestones and review points.
- Compare the schedule against workload and known risks.
- Review the chart during status meetings and update it when the plan changes.
If your schedule has many dependencies, use the critical path method guide to identify which sequence controls the final date.
Common Gantt Chart Mistakes
Treating the chart as a one-time plan
A Gantt chart should change when work changes. If the project manager updates it only before executive reviews, the chart will stop matching delivery reality.
Scheduling without capacity
Dates can look clean while one person owns too much work in the same week. Check workload before approving the schedule.
Hiding dependency risk
Dependencies should be visible enough that teams can see what happens when one task slips.
Making the chart too detailed
Do not turn every tiny action into a Gantt bar. Use task boards for daily execution and use the Gantt chart for schedule logic.
FAQ
Frequently
asked
questions
Related features
Explore the Scrumbuiss features mentioned in this article.
- Gantt Timeline
Plan dependencies, milestones, and schedule changes with a Gantt chart view that stays close to execution.
Unlock Success &
Power Up Your Projects
Next to explore
Explore more pages to understand the product suite, common workflows, and evaluation guides.