Project Dashboard Examples for Status, Risk, and Delivery Reviews
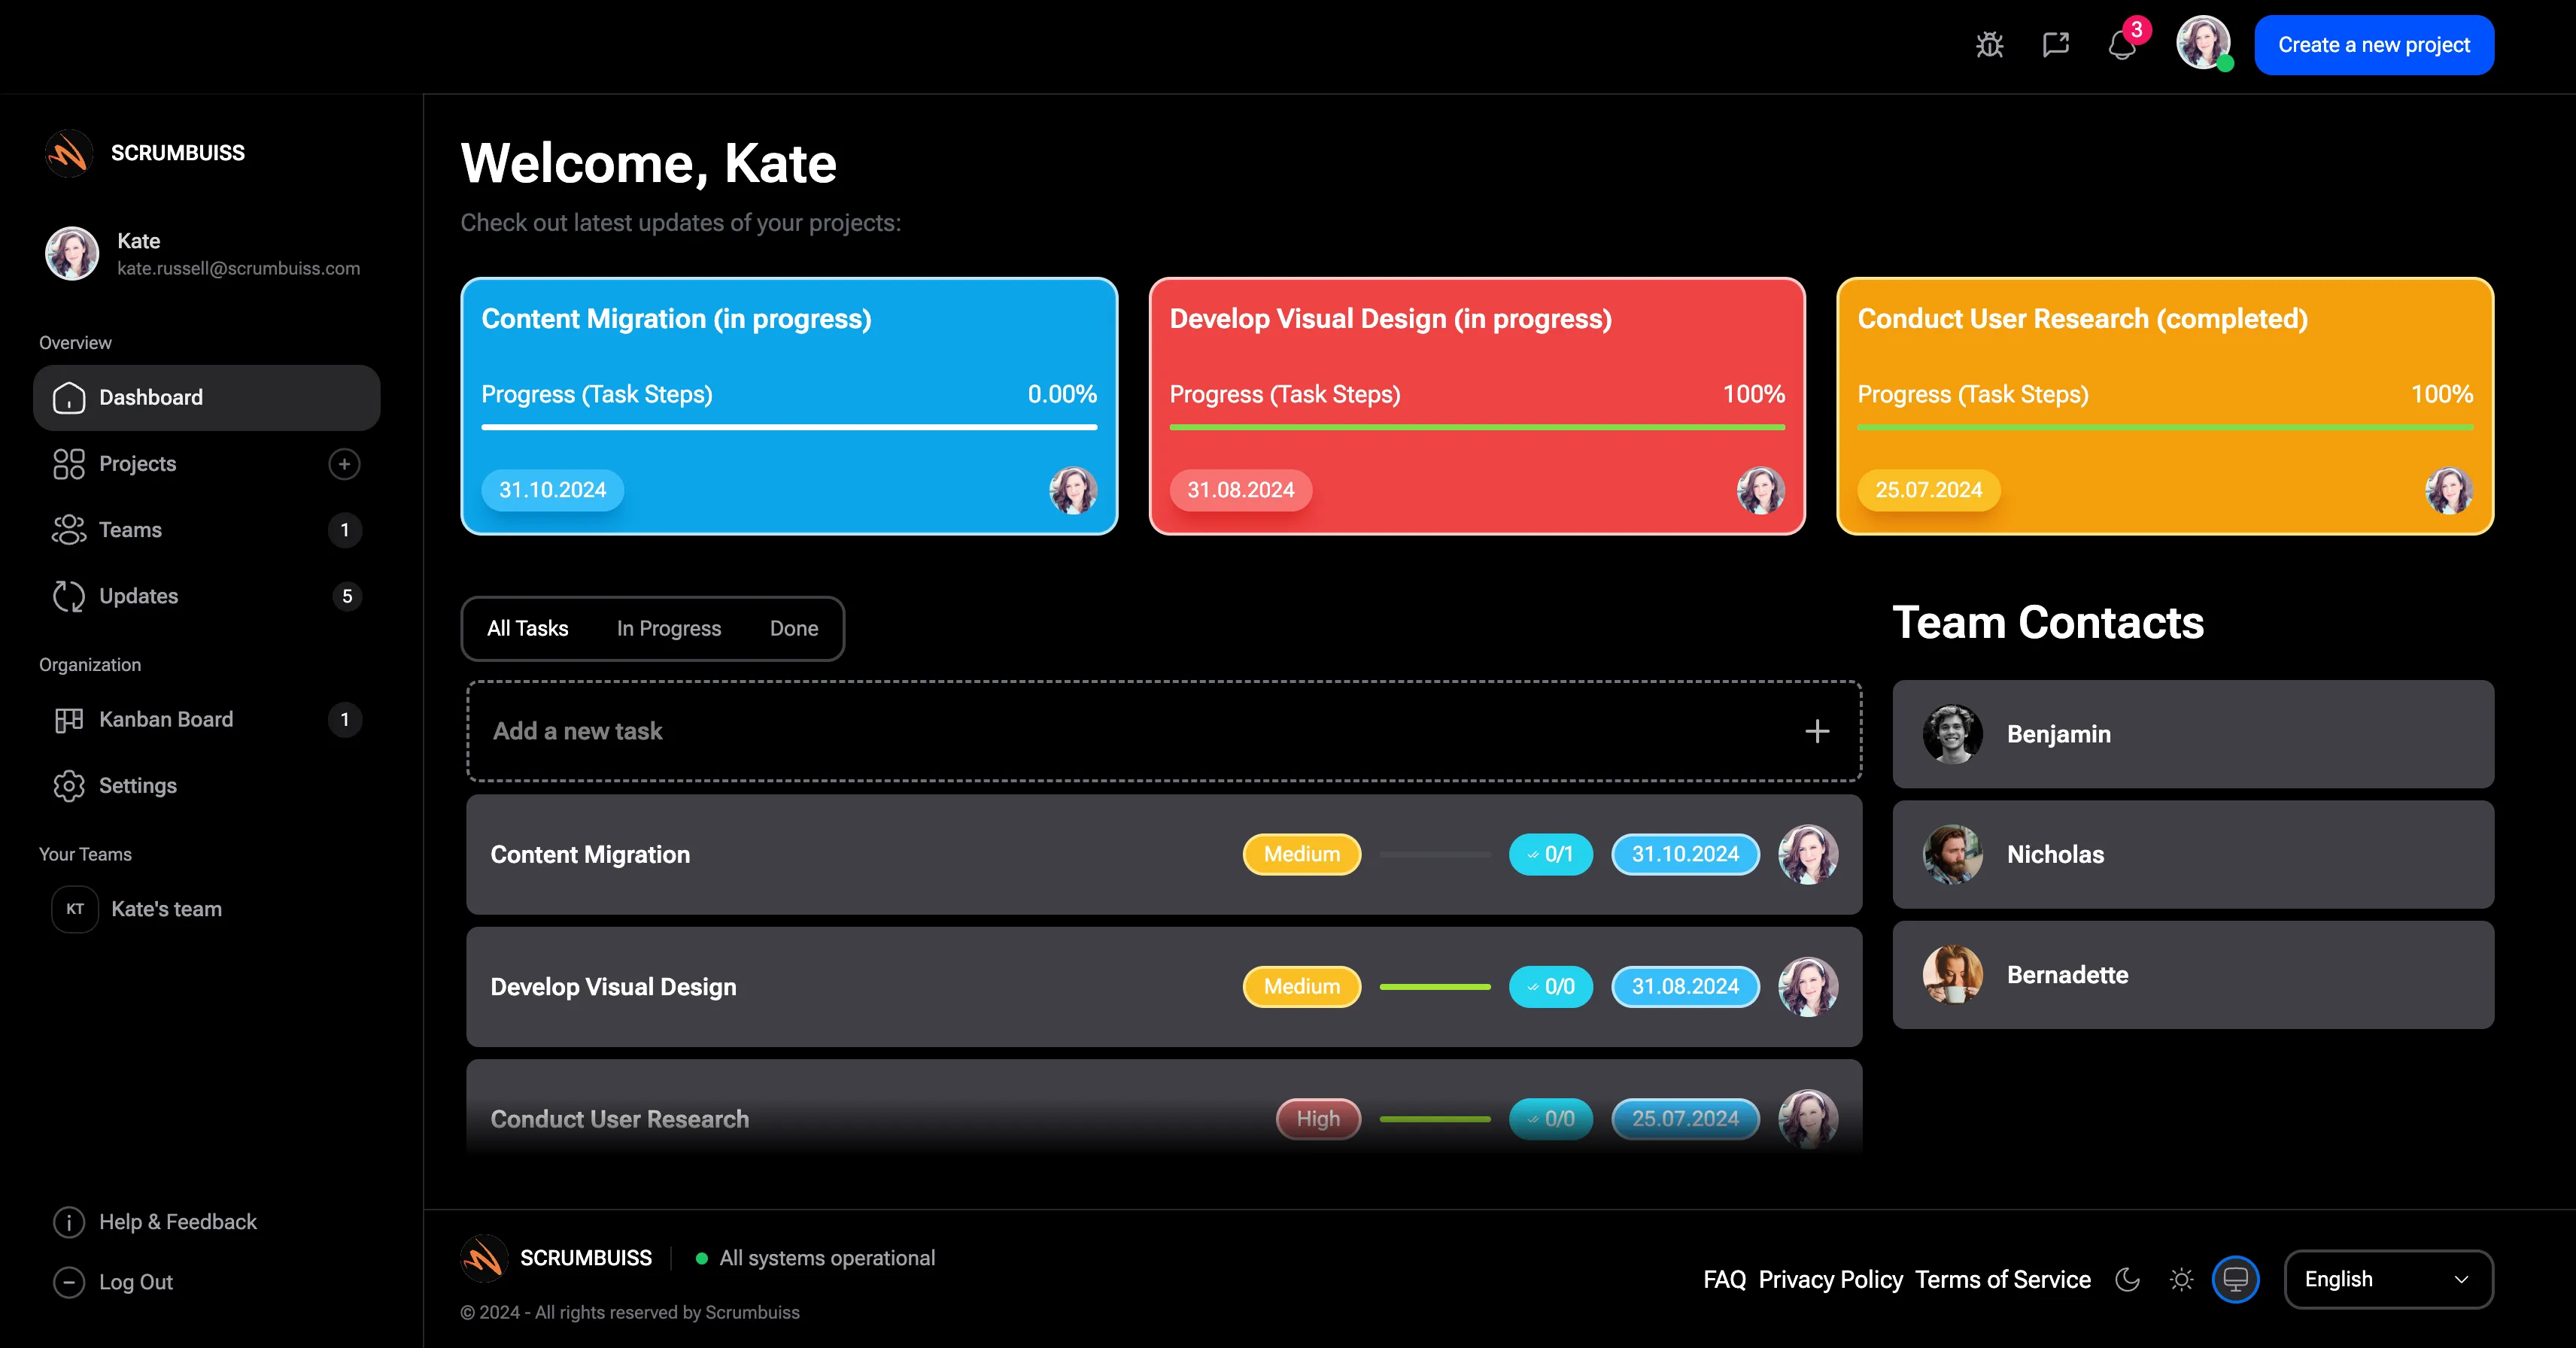
Project dashboards help teams turn live project data into a view that people can actually use. A good dashboard shows progress, risk, blockers, workload, milestones, and next decisions without forcing a project manager to rebuild the story in a spreadsheet or slide deck.
This guide focuses on "project dashboard examples" and practical dashboard patterns. It is not a replacement for the Scrumbuiss project management dashboard software page, which explains the product and buying workflow. Here, the goal is to help you decide what type of dashboard your team needs and what each one should show.
Key Takeaways
- A useful project dashboard is built around a decision, not a collection of charts.
- Most teams need different dashboard examples for delivery teams, managers, executives, clients, and portfolio review.
- Strong dashboards combine status, trend, owner, risk, and next action.
- A dashboard is only trustworthy when it stays connected to live work and the weekly status report.
What Is a Project Dashboard?
A project dashboard is a visual summary of project health, progress, and risks. It helps teams and stakeholders answer questions quickly:
- Is the project on track?
- What changed since the last review?
- Which work is blocked?
- Which milestone or owner needs attention?
- Where is capacity tight?
- What decision is needed next?
The best project dashboards do not try to show everything. They show the few signals that drive the next decision.
Example 1: Weekly Project Status Dashboard
Use this dashboard for recurring stakeholder updates.
| Widget | What it should show |
|---|---|
| Overall status | On track, at risk, off track, or paused |
| Milestone progress | Current milestone, due date, confidence |
| Completed this week | Outcomes finished since the last update |
| Next-week priorities | Work that matters most in the next reporting period |
| Risks and blockers | Owner, severity, next action |
| Decisions needed | Decision, accountable person, due date |
This dashboard should match the written weekly project status report. If the dashboard says "on track" but the report says "at risk," readers will stop trusting both.
Example 2: Delivery Team Dashboard
Use this dashboard inside the team that is doing the work.
| Widget | Why it matters |
|---|---|
| Active work by status | Shows what is waiting, in progress, blocked, and in review |
| Blocked work age | Highlights work that has waited too long |
| Owner workload | Shows whether one person is carrying too much |
| Upcoming due dates | Keeps near-term commitments visible |
| Review queue | Prevents finished work from waiting silently |
| Recent changes | Helps the team see scope, priority, or date movement |
Delivery dashboards should be operational. They should help the team act today, not only explain the project later.
Example 3: Executive Project Dashboard
Use this dashboard when leaders need a fast portfolio-level view.
| Widget | What executives need |
|---|---|
| Project health summary | Count of on-track, at-risk, off-track, and paused projects |
| Strategic priority | Which projects support the most important business goals |
| Milestone confidence | Whether key dates are credible |
| Major risks | Risks that need leadership attention |
| Budget or effort trend | Whether the project is staying within expected effort |
| Decisions needed | Escalations that require leadership action |
Executive dashboards should avoid task-level detail. They should let a leader move from a summary to the underlying project only when needed.
Example 4: Resource and Workload Dashboard
Use this dashboard when commitments depend on shared people or specialist roles.
| Widget | What it shows |
|---|---|
| Capacity by person or role | Available time compared with planned demand |
| Overallocated owners | People or roles above sustainable load |
| Project demand by week | When effort is needed |
| Work by priority | Whether high-priority work is getting capacity first |
| Bottleneck roles | Shared specialists that could delay several projects |
This dashboard supports resource capacity planning. It is especially useful for agencies, product teams, IT operations, and shared service teams.
Example 5: Risk Dashboard
Use this dashboard when project risk review needs to be recurring, not occasional.
| Widget | What it shows |
|---|---|
| Open risks by severity | Which risks need attention first |
| Risk trend | Whether risk exposure is improving or worsening |
| Mitigation owner | Who owns the next action |
| Due mitigation actions | Follow-ups that are late or near deadline |
| Escalation needed | Risks that need sponsor or leadership support |
Scrumbuiss Risk Center is useful when teams need risk ownership, review signals, and delivery context in one workflow.
Example 6: Client Project Dashboard
Use this dashboard for client-facing delivery or agency work.
| Widget | What clients usually need |
|---|---|
| Current status | Plain-language health and progress |
| Deliverables | What is complete, in review, or upcoming |
| Open approvals | What the client needs to approve |
| Risks or blockers | Issues that affect scope, date, or quality |
| Files and links | Latest approved assets, briefs, or reports |
| Next meeting focus | Decisions or topics for the next check-in |
Client dashboards should be readable without internal shorthand. Use a client portal when clients need access without seeing every internal task.
What Every Project Dashboard Should Avoid
Avoid dashboards that:
- show too many charts with no decision hierarchy
- hide ownership and next action
- rely on manual copy-paste from other tools
- mix stale and current data
- use unclear health labels
- show task volume without risk or milestone context
- look impressive but do not help anyone replan
A dashboard is successful when it changes behavior: faster escalation, clearer tradeoffs, better status reviews, and fewer surprise delays.
Project Dashboard Build Checklist
Before building a dashboard, define:
| Question | Example answer |
|---|---|
| Who is the dashboard for? | Delivery lead, executive, client, project team |
| What decision should it support? | Replan work, approve scope, escalate risk, review status |
| How often will it be reviewed? | Daily, weekly, monthly, milestone-based |
| What data source is trusted? | Project workspace, timeline, risk register, time tracking |
| What does each health label mean? | On track, at risk, off track, paused |
| What action happens after review? | Reassign, escalate, approve, defer, close |
FAQ
Frequently
asked
questions
Related features
Explore the Scrumbuiss features mentioned in this article.
- Dashboard
Track project progress, blockers, workload, KPIs, status reporting, and analytics context in one live dashboard.
- Client Portal
Invite clients into a controlled onboarding, file-sharing, and status workflow.
Unlock Success &
Power Up Your Projects
Next to explore
Explore more pages to understand the product suite, common workflows, and evaluation guides.