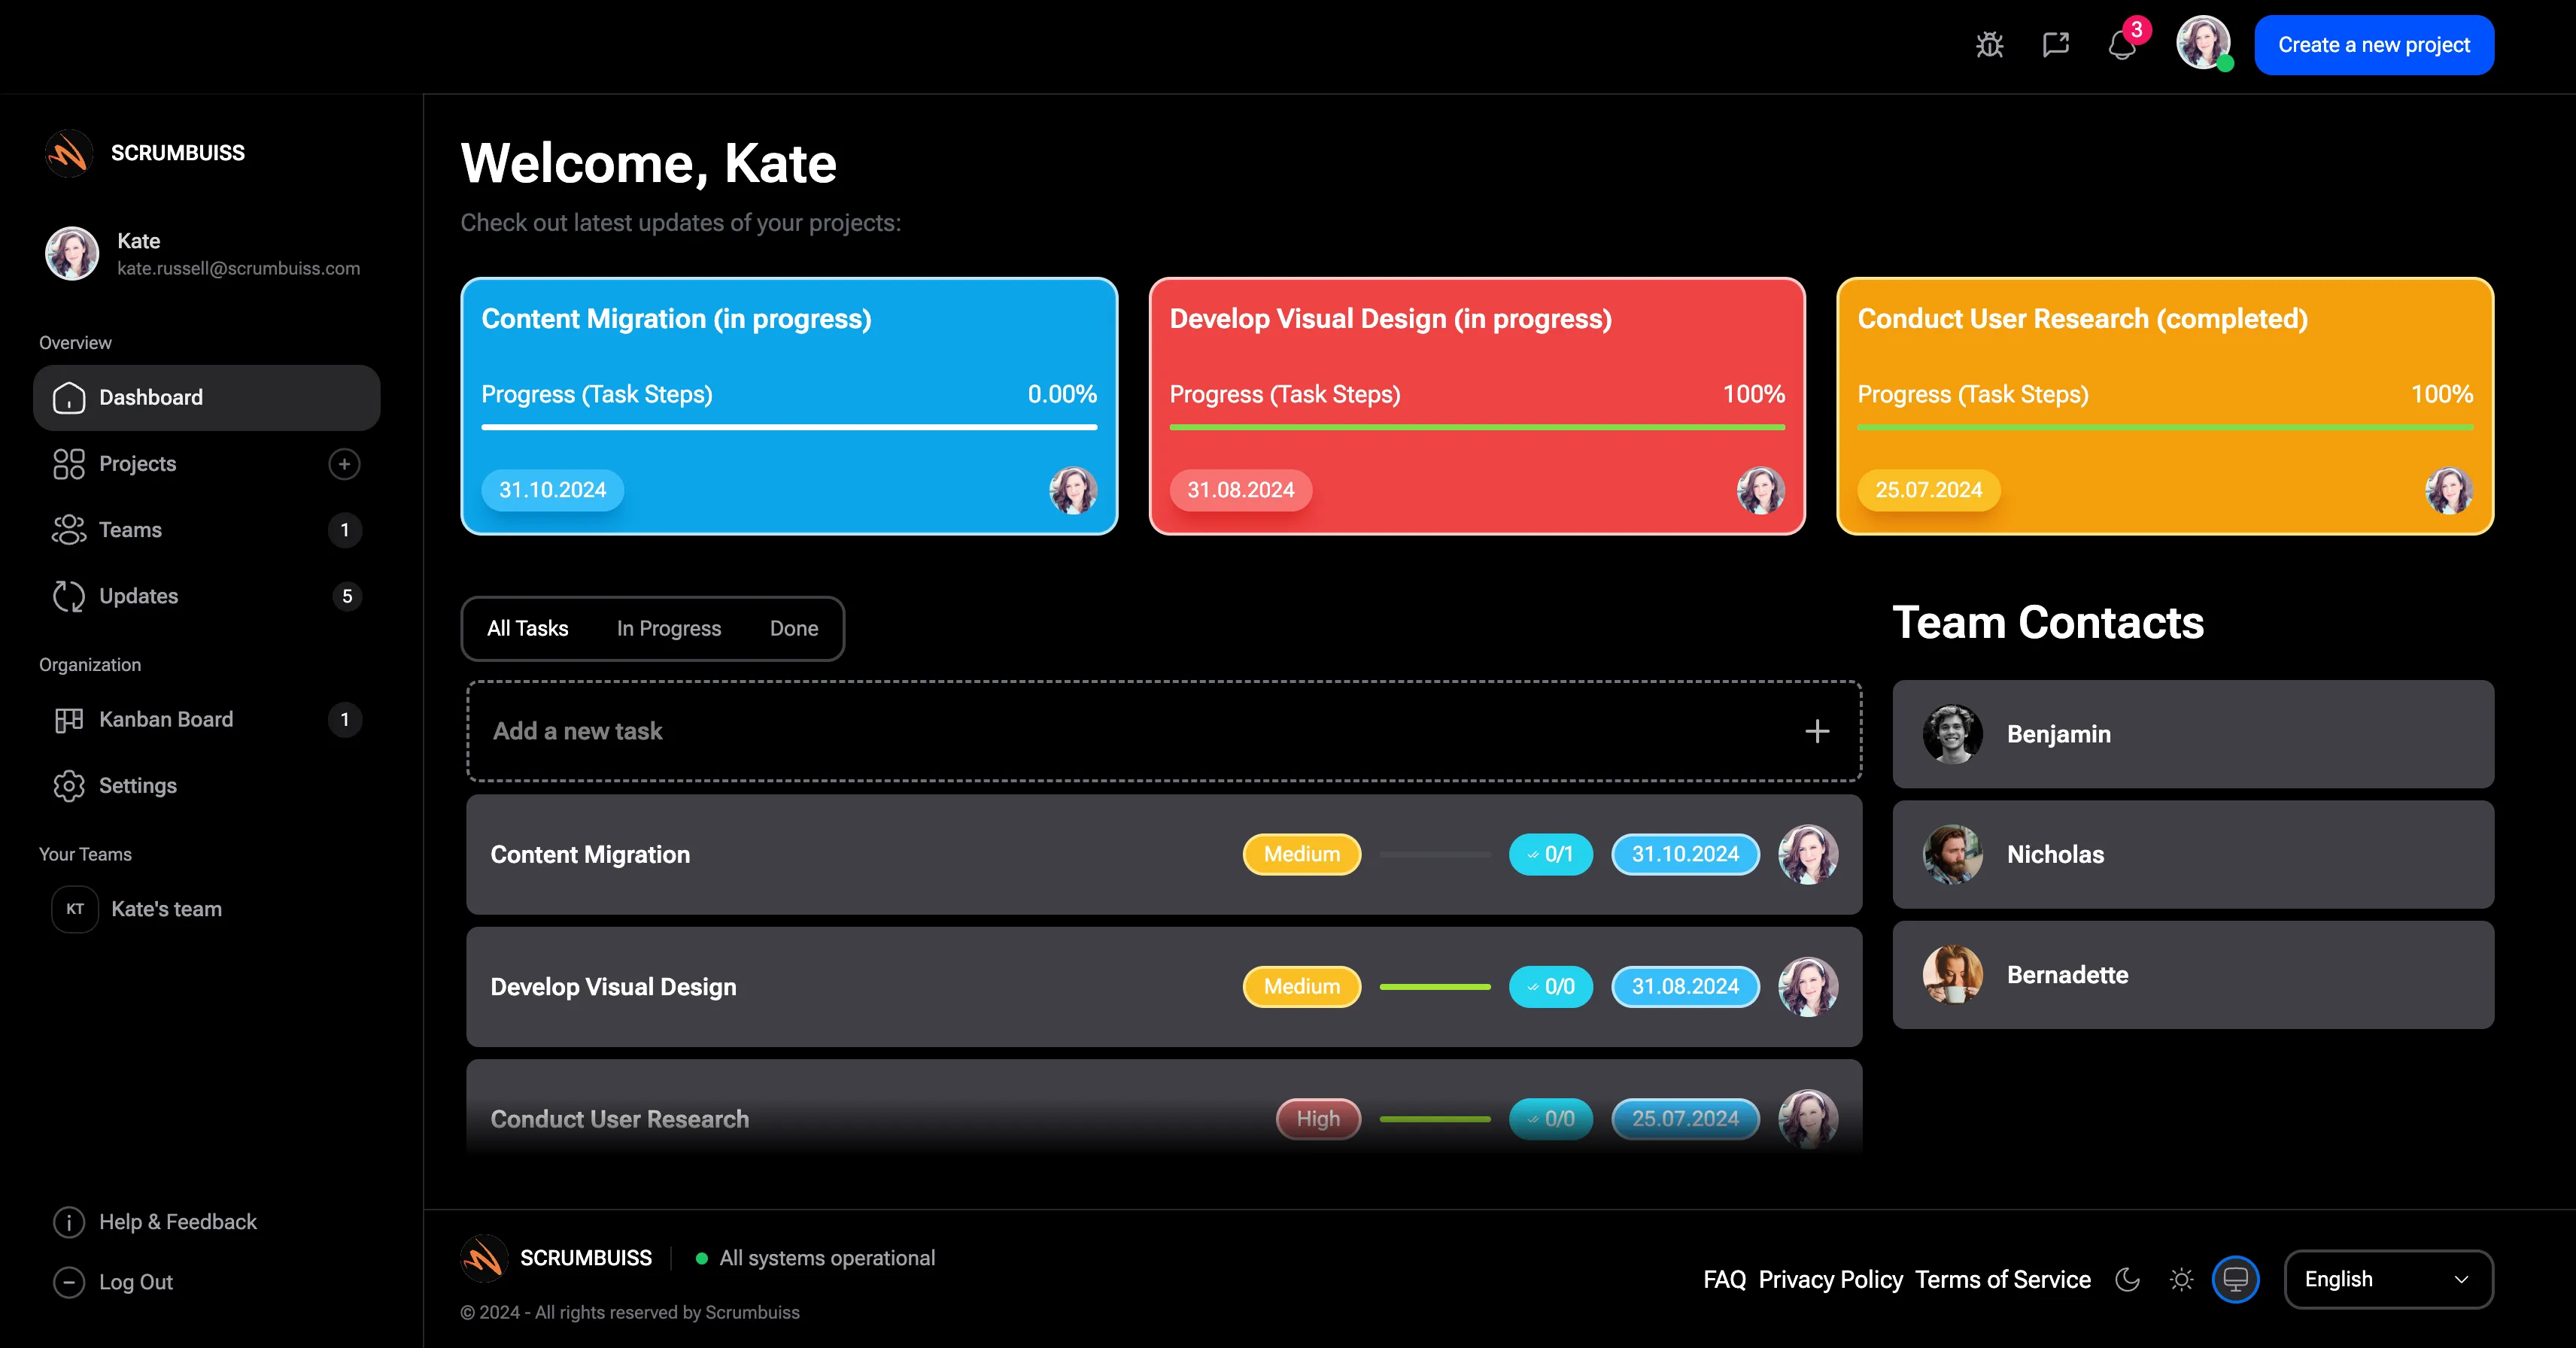
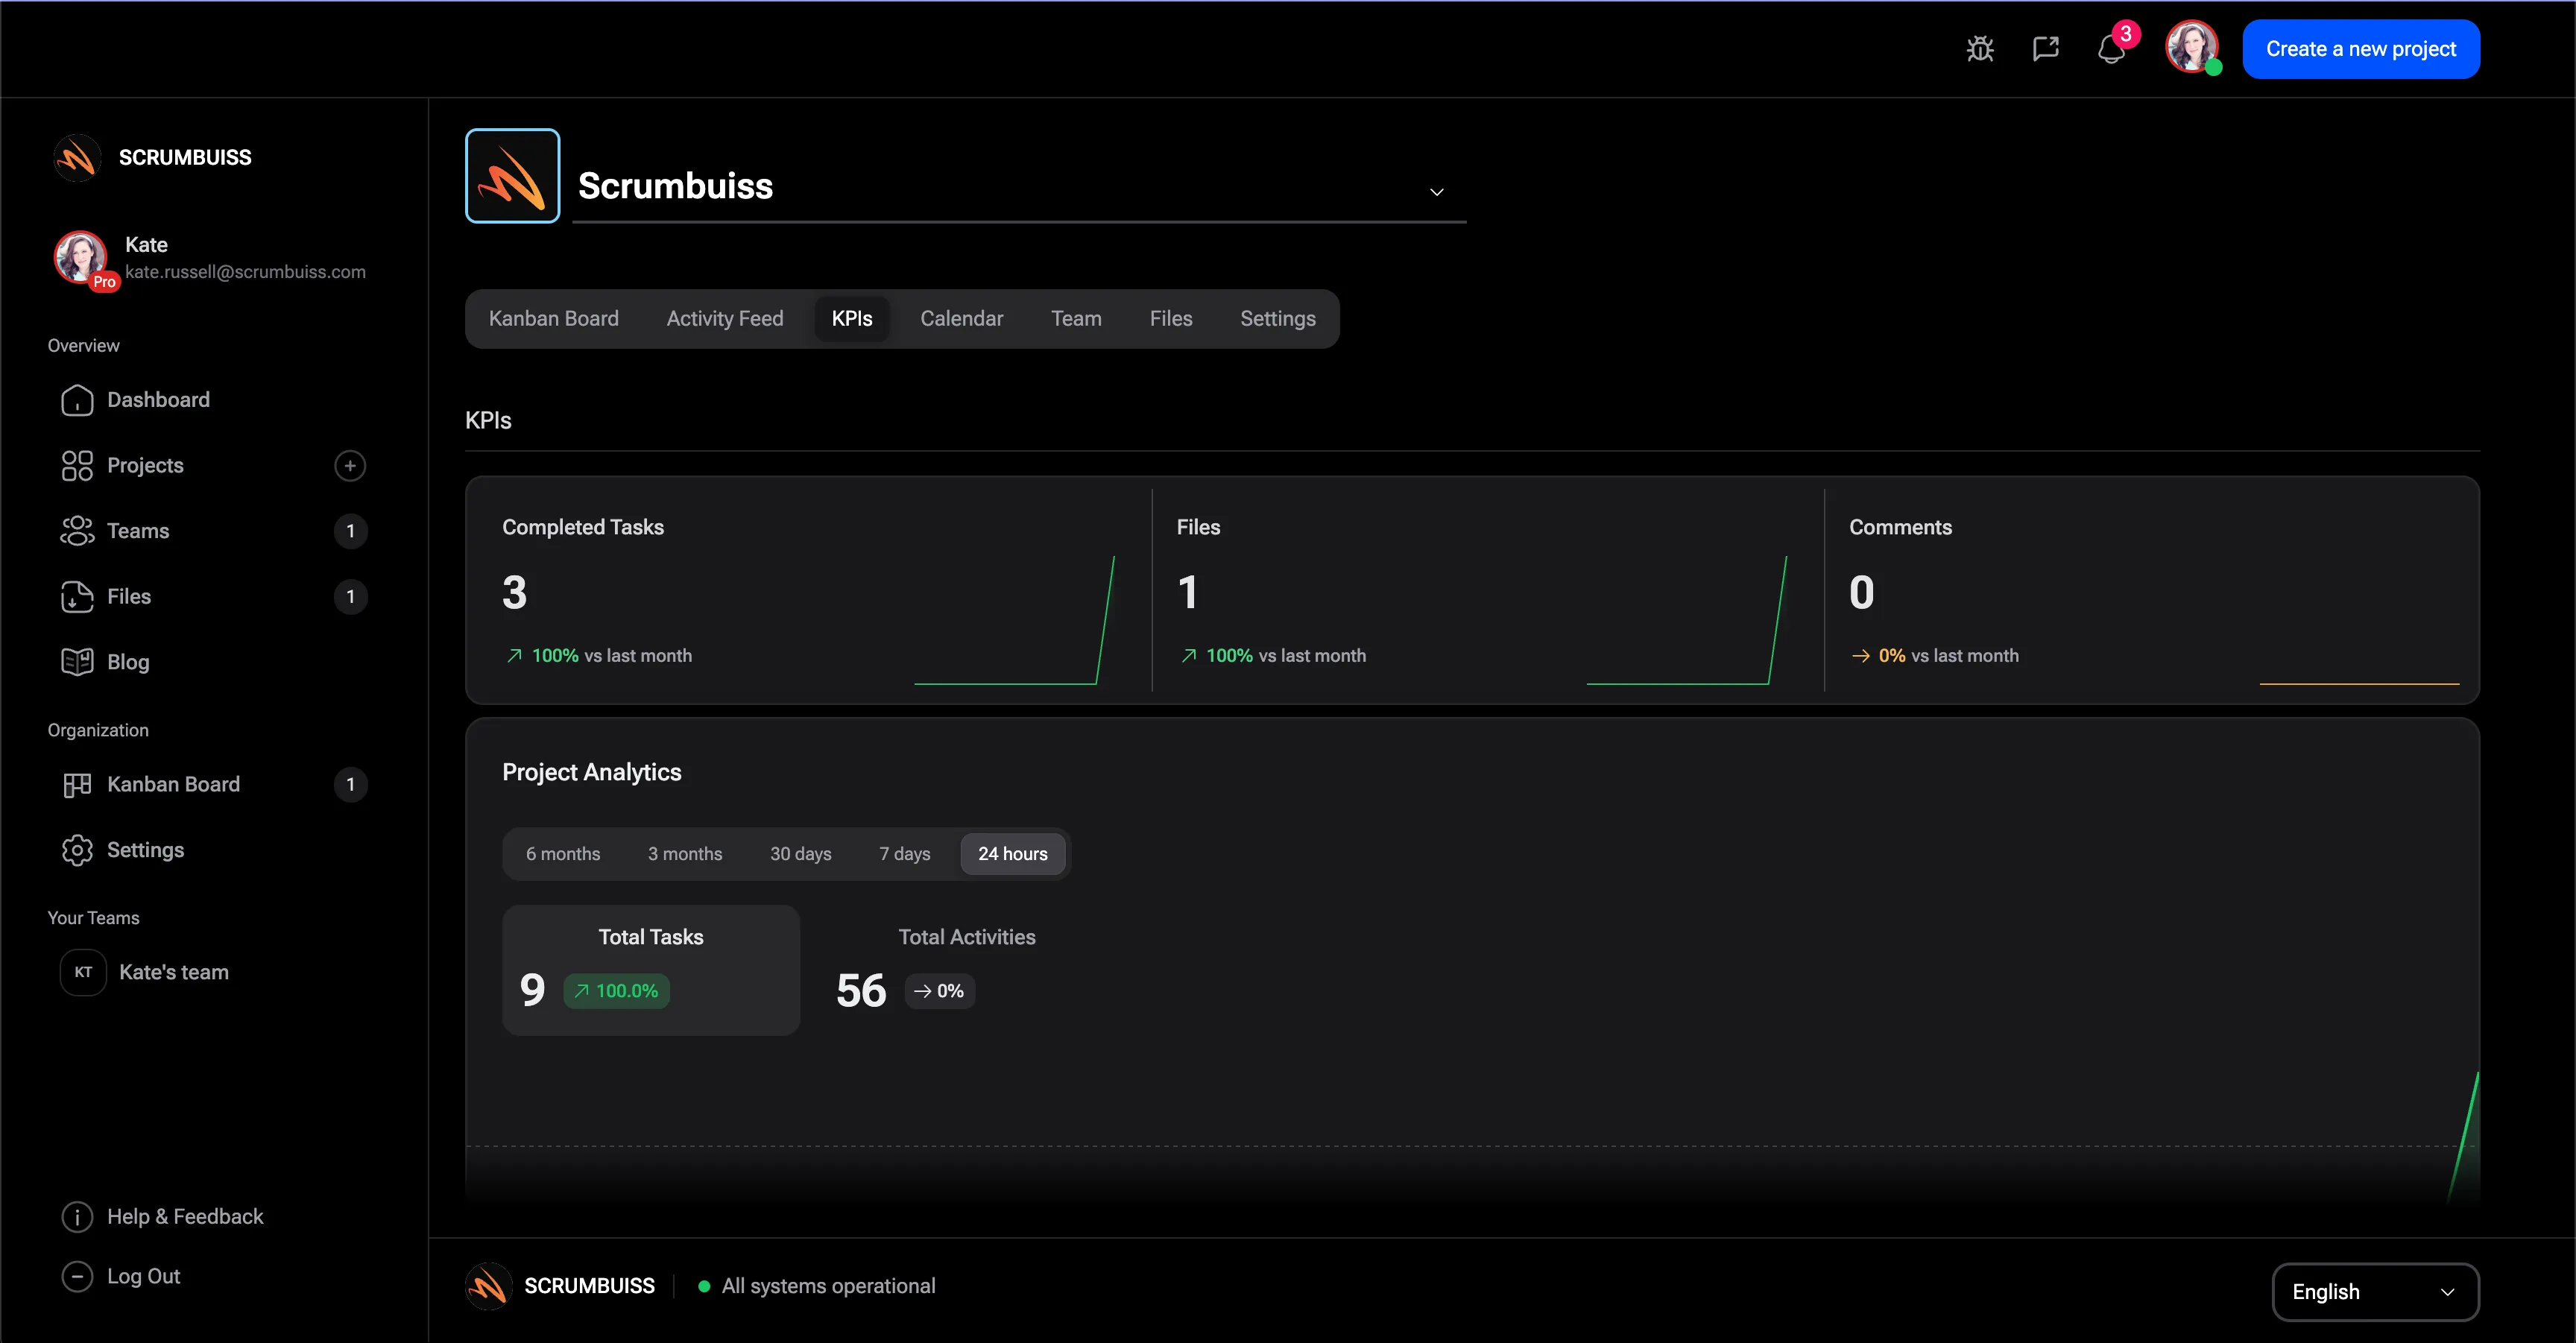
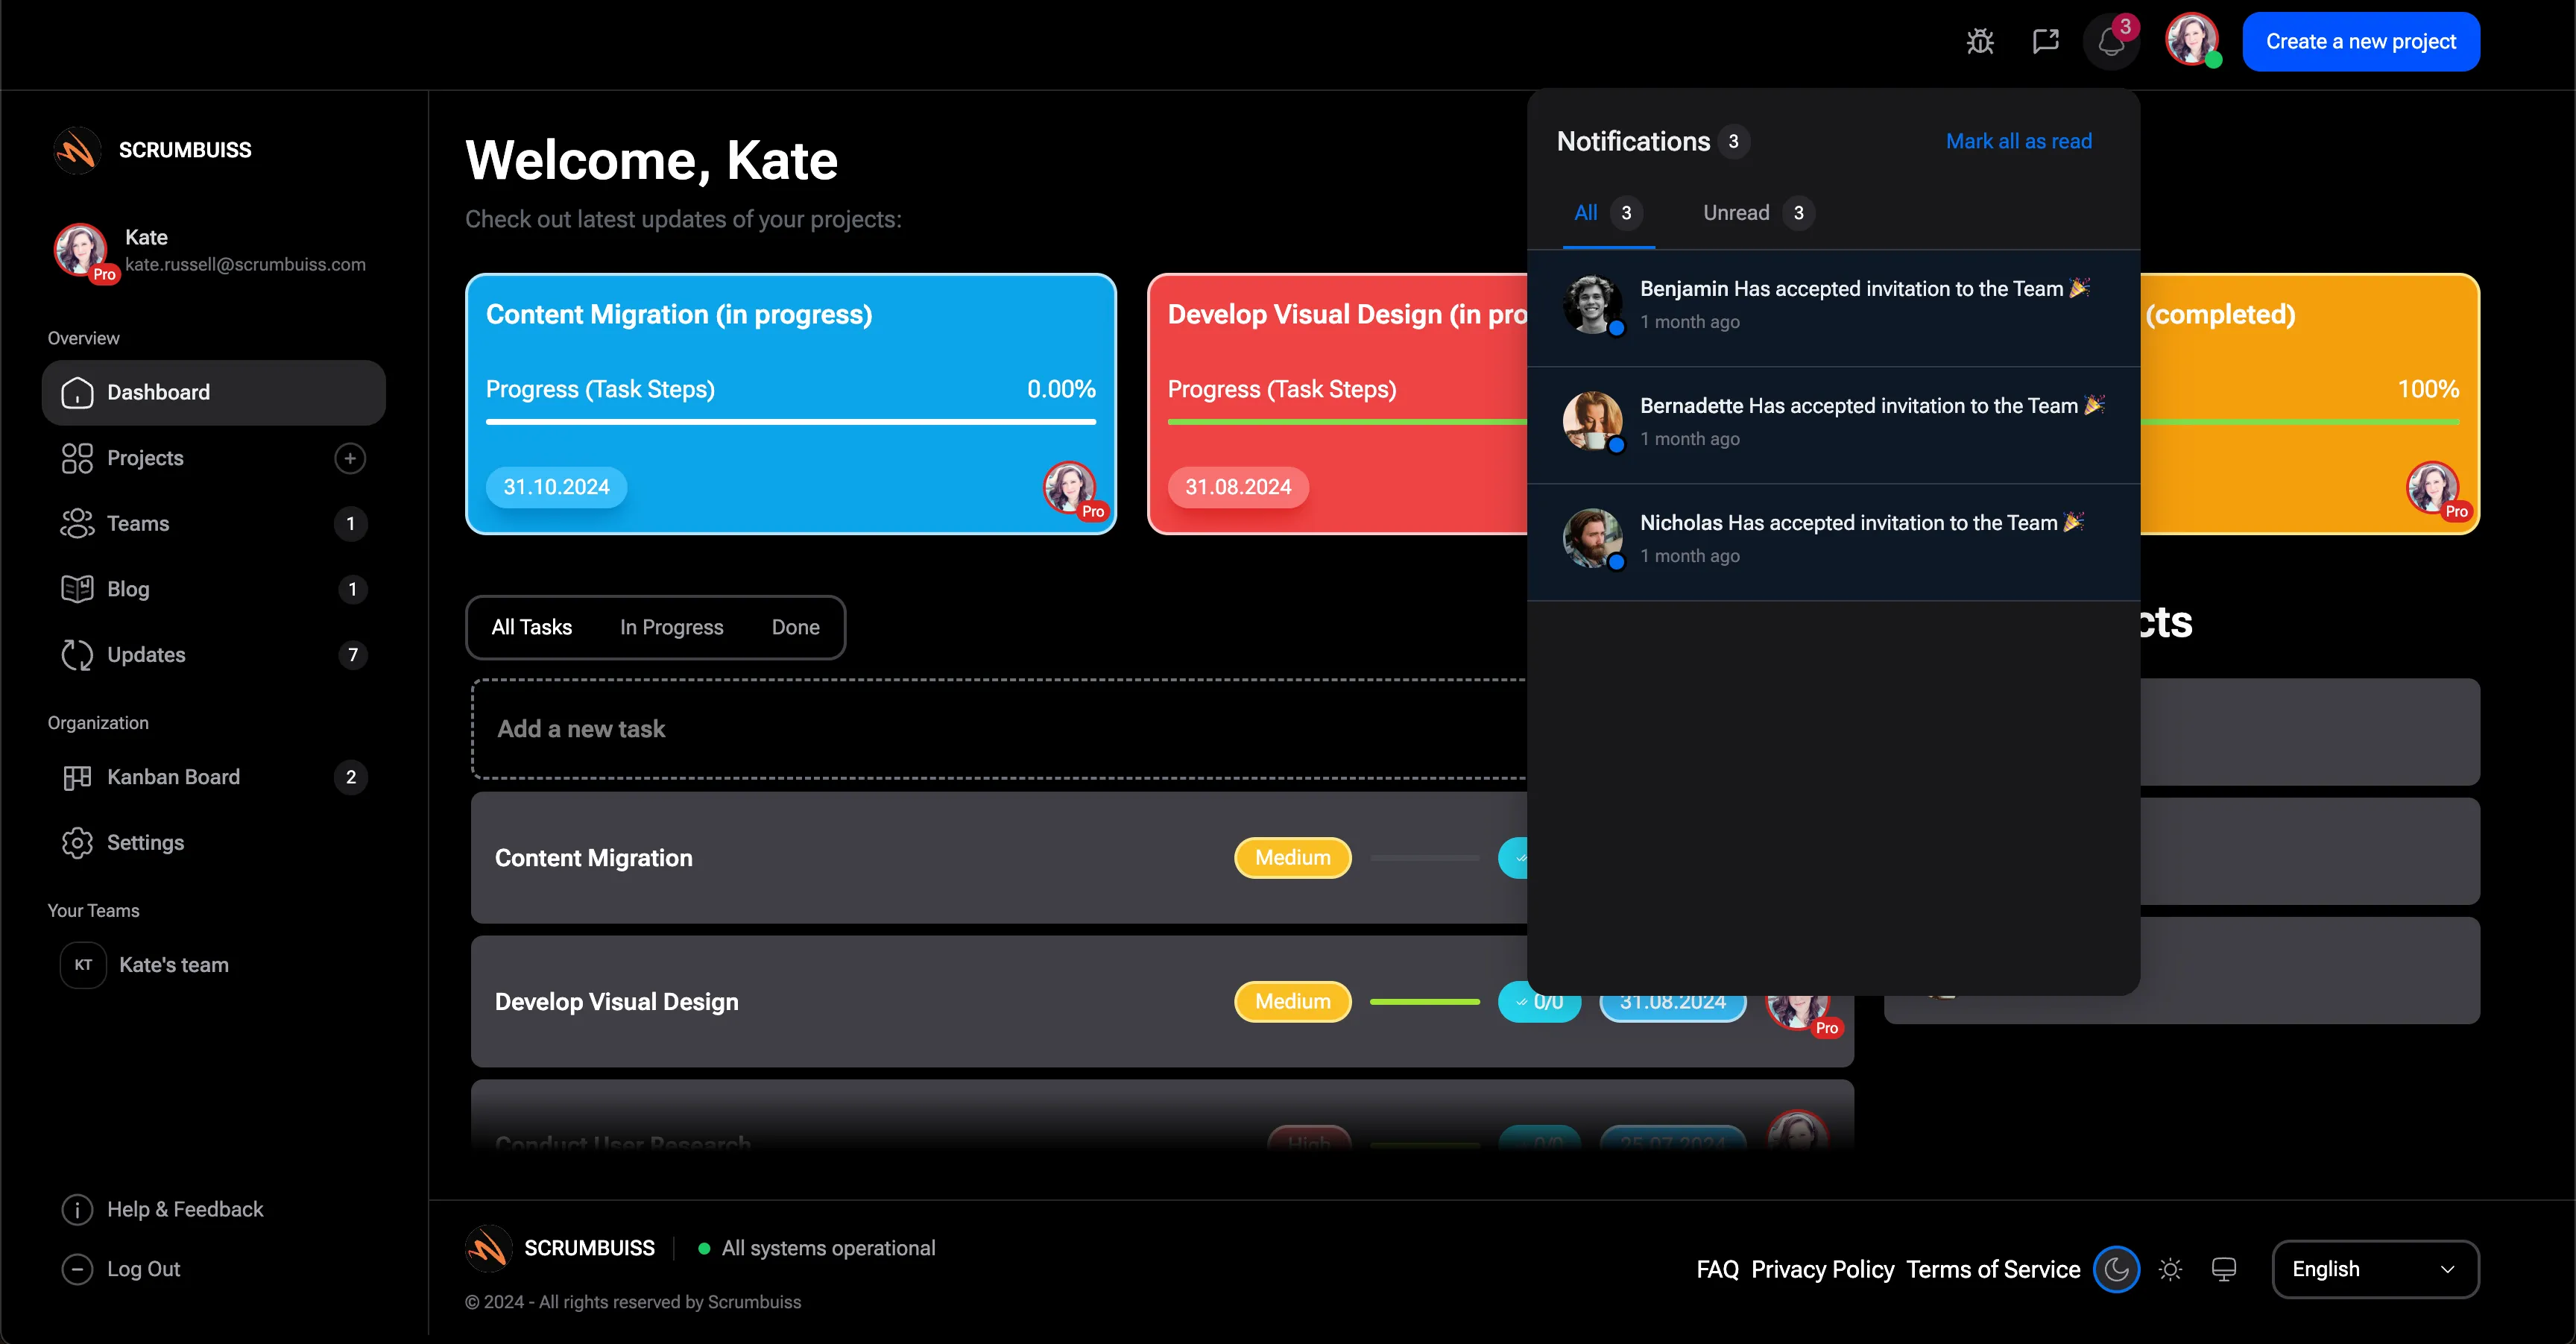
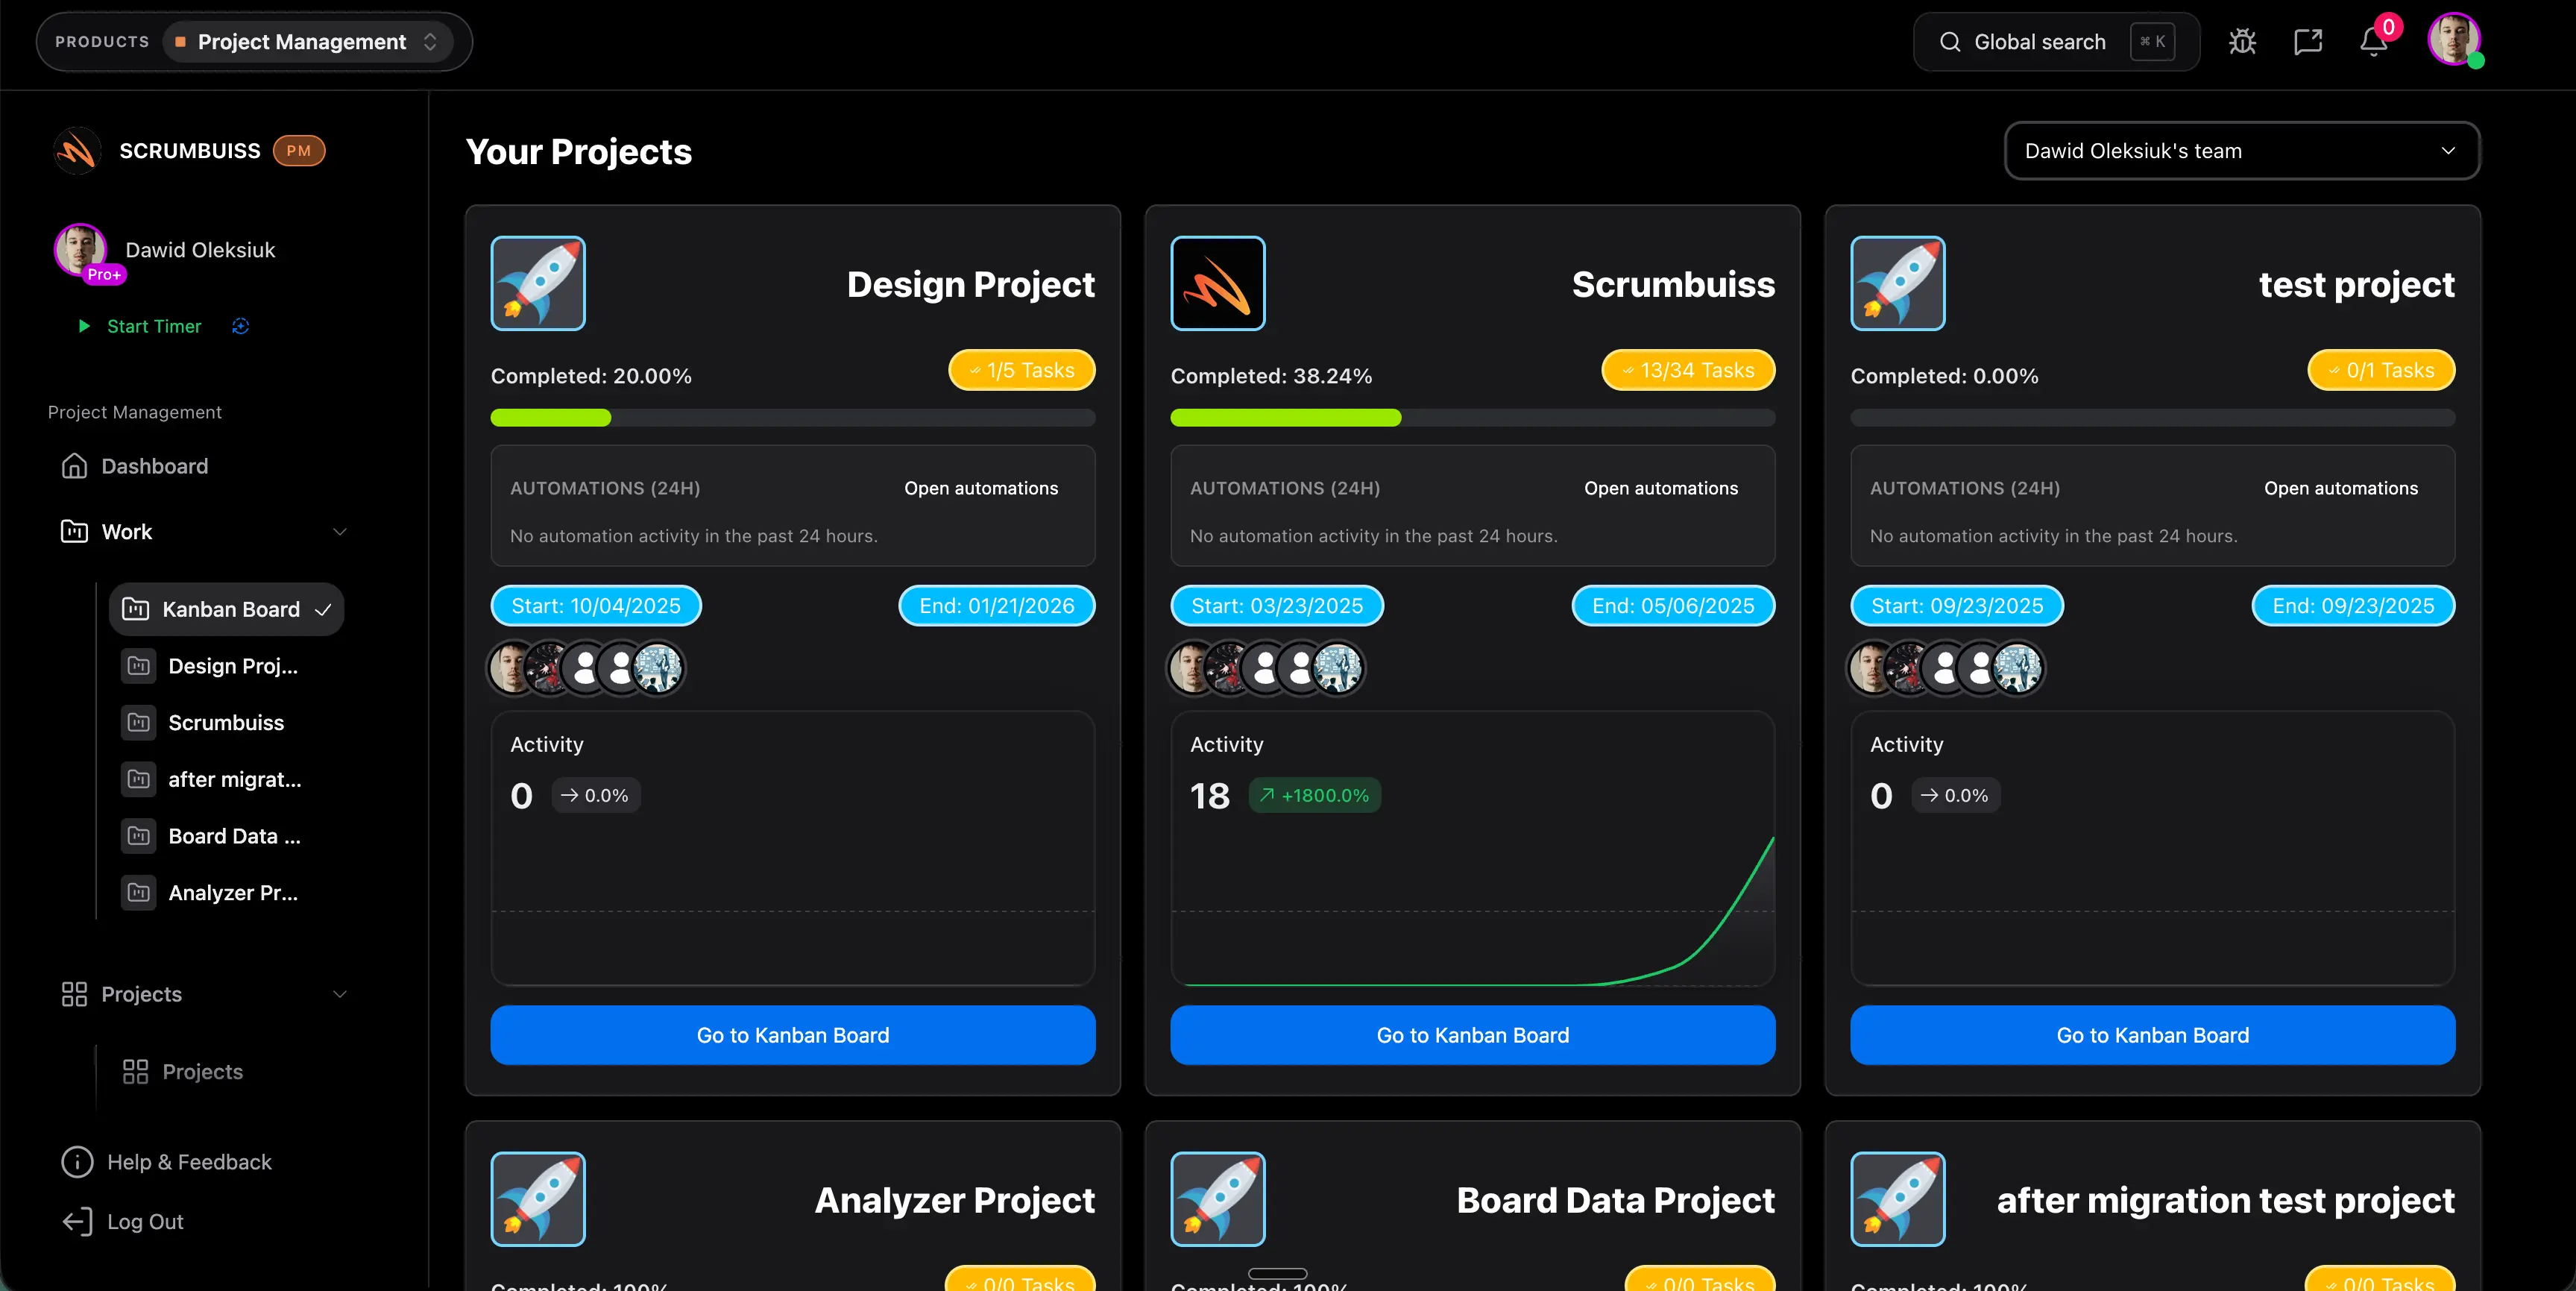
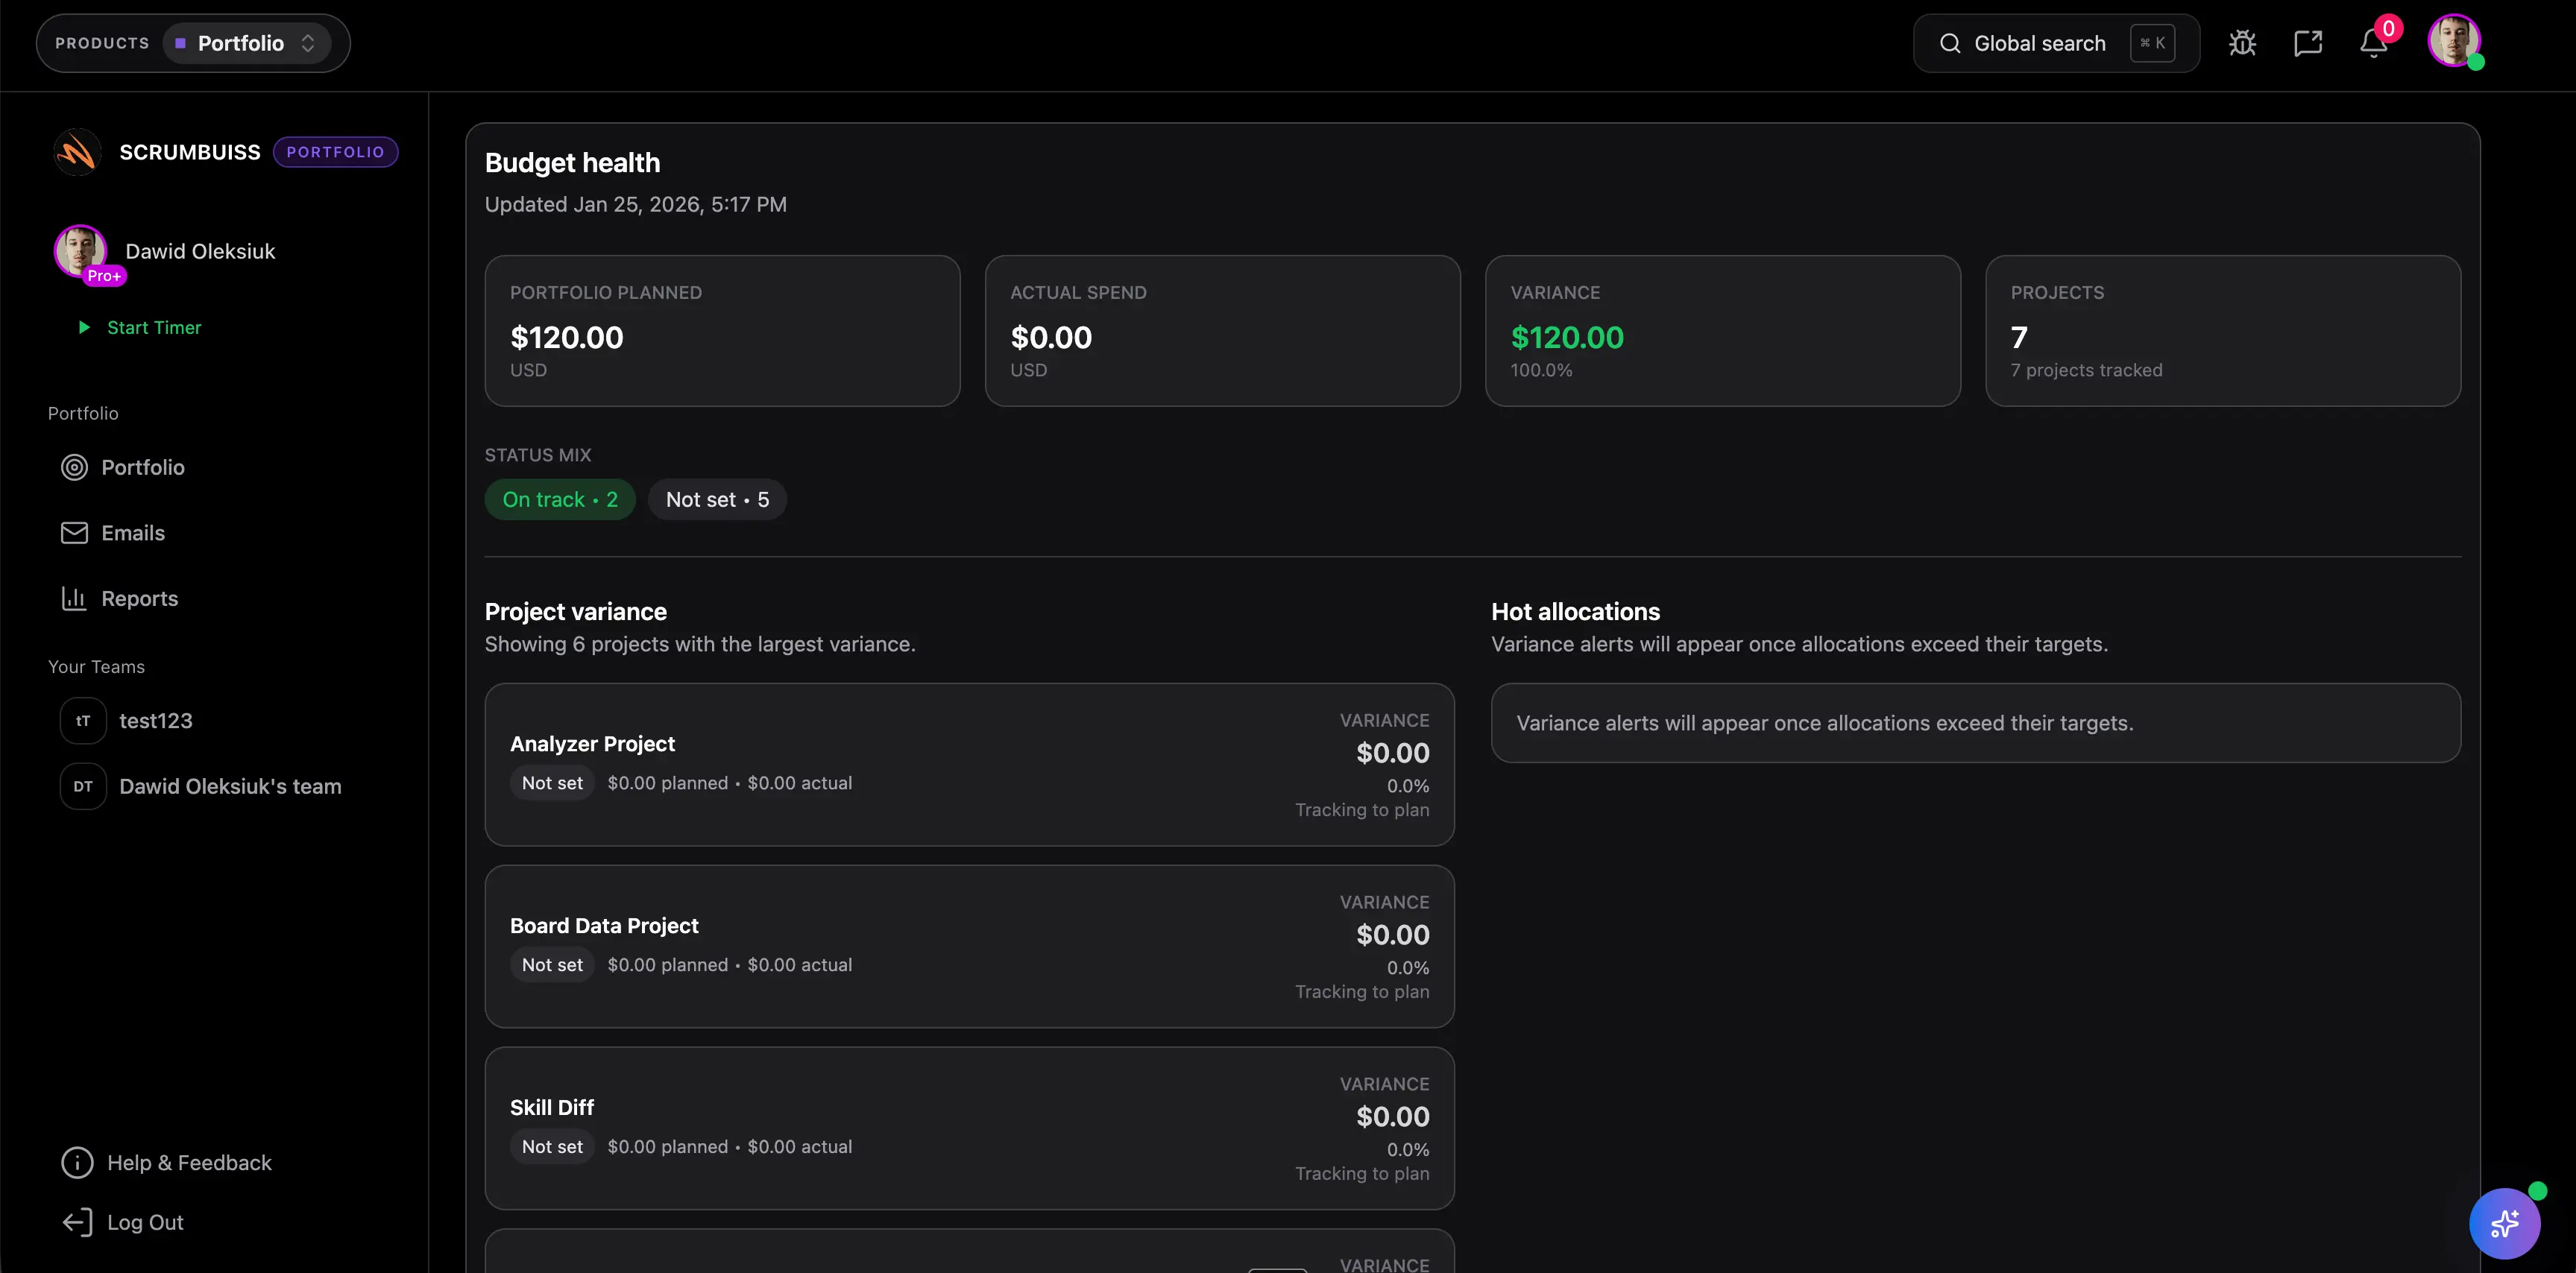
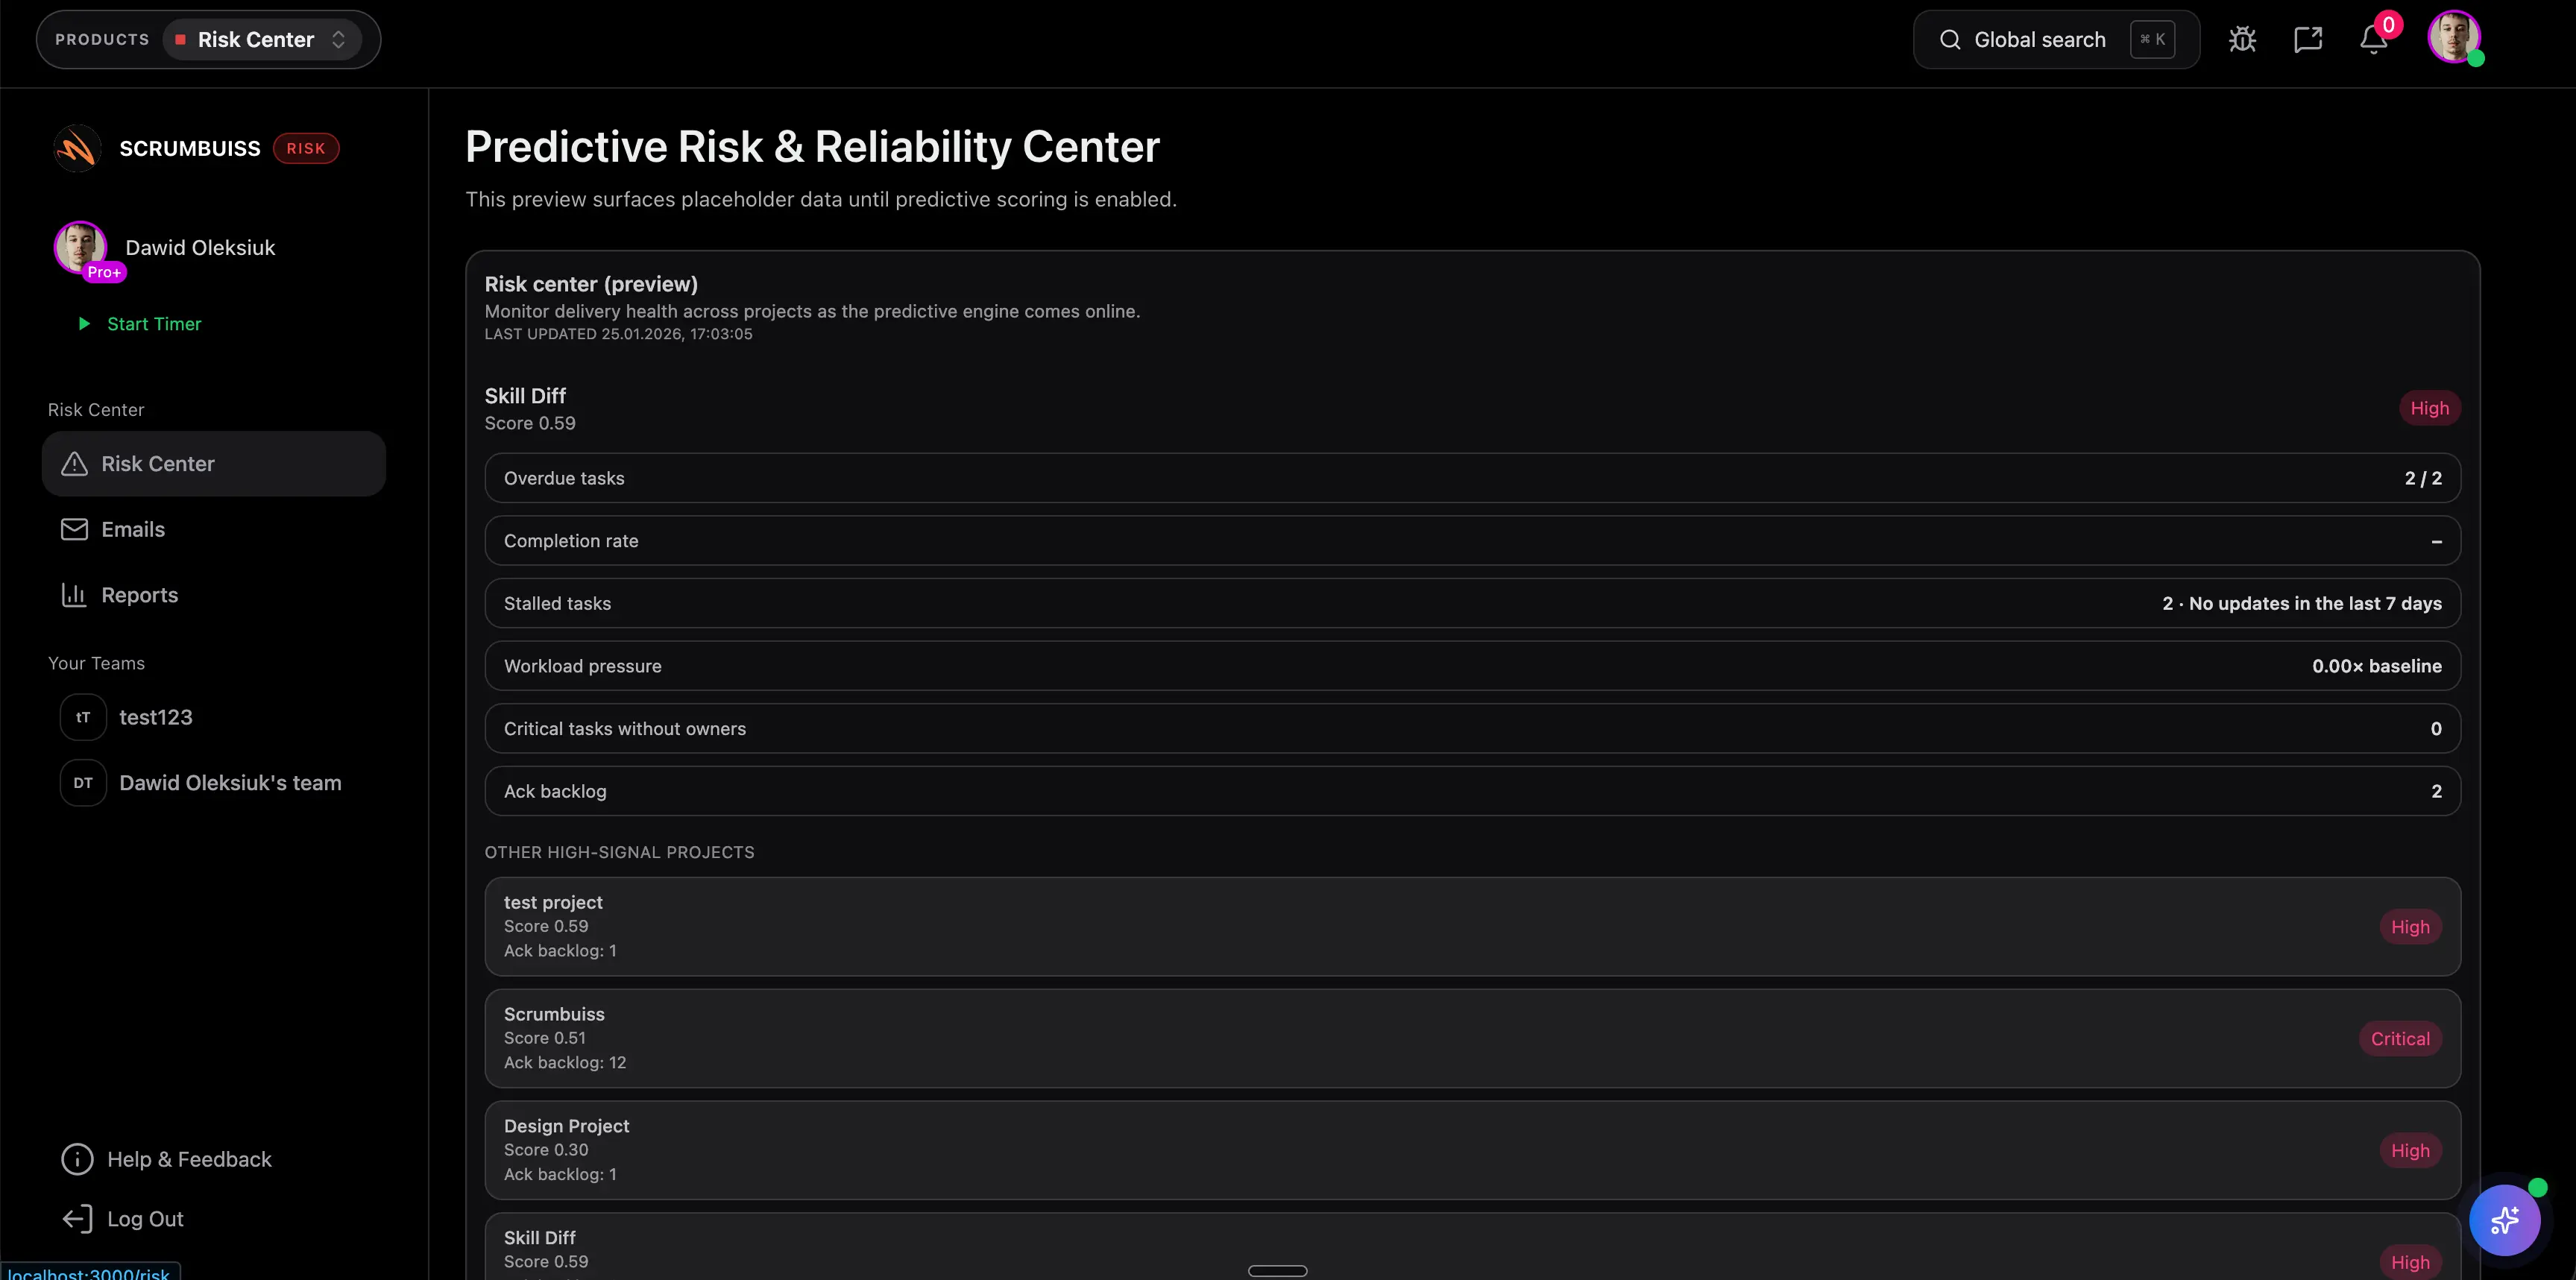
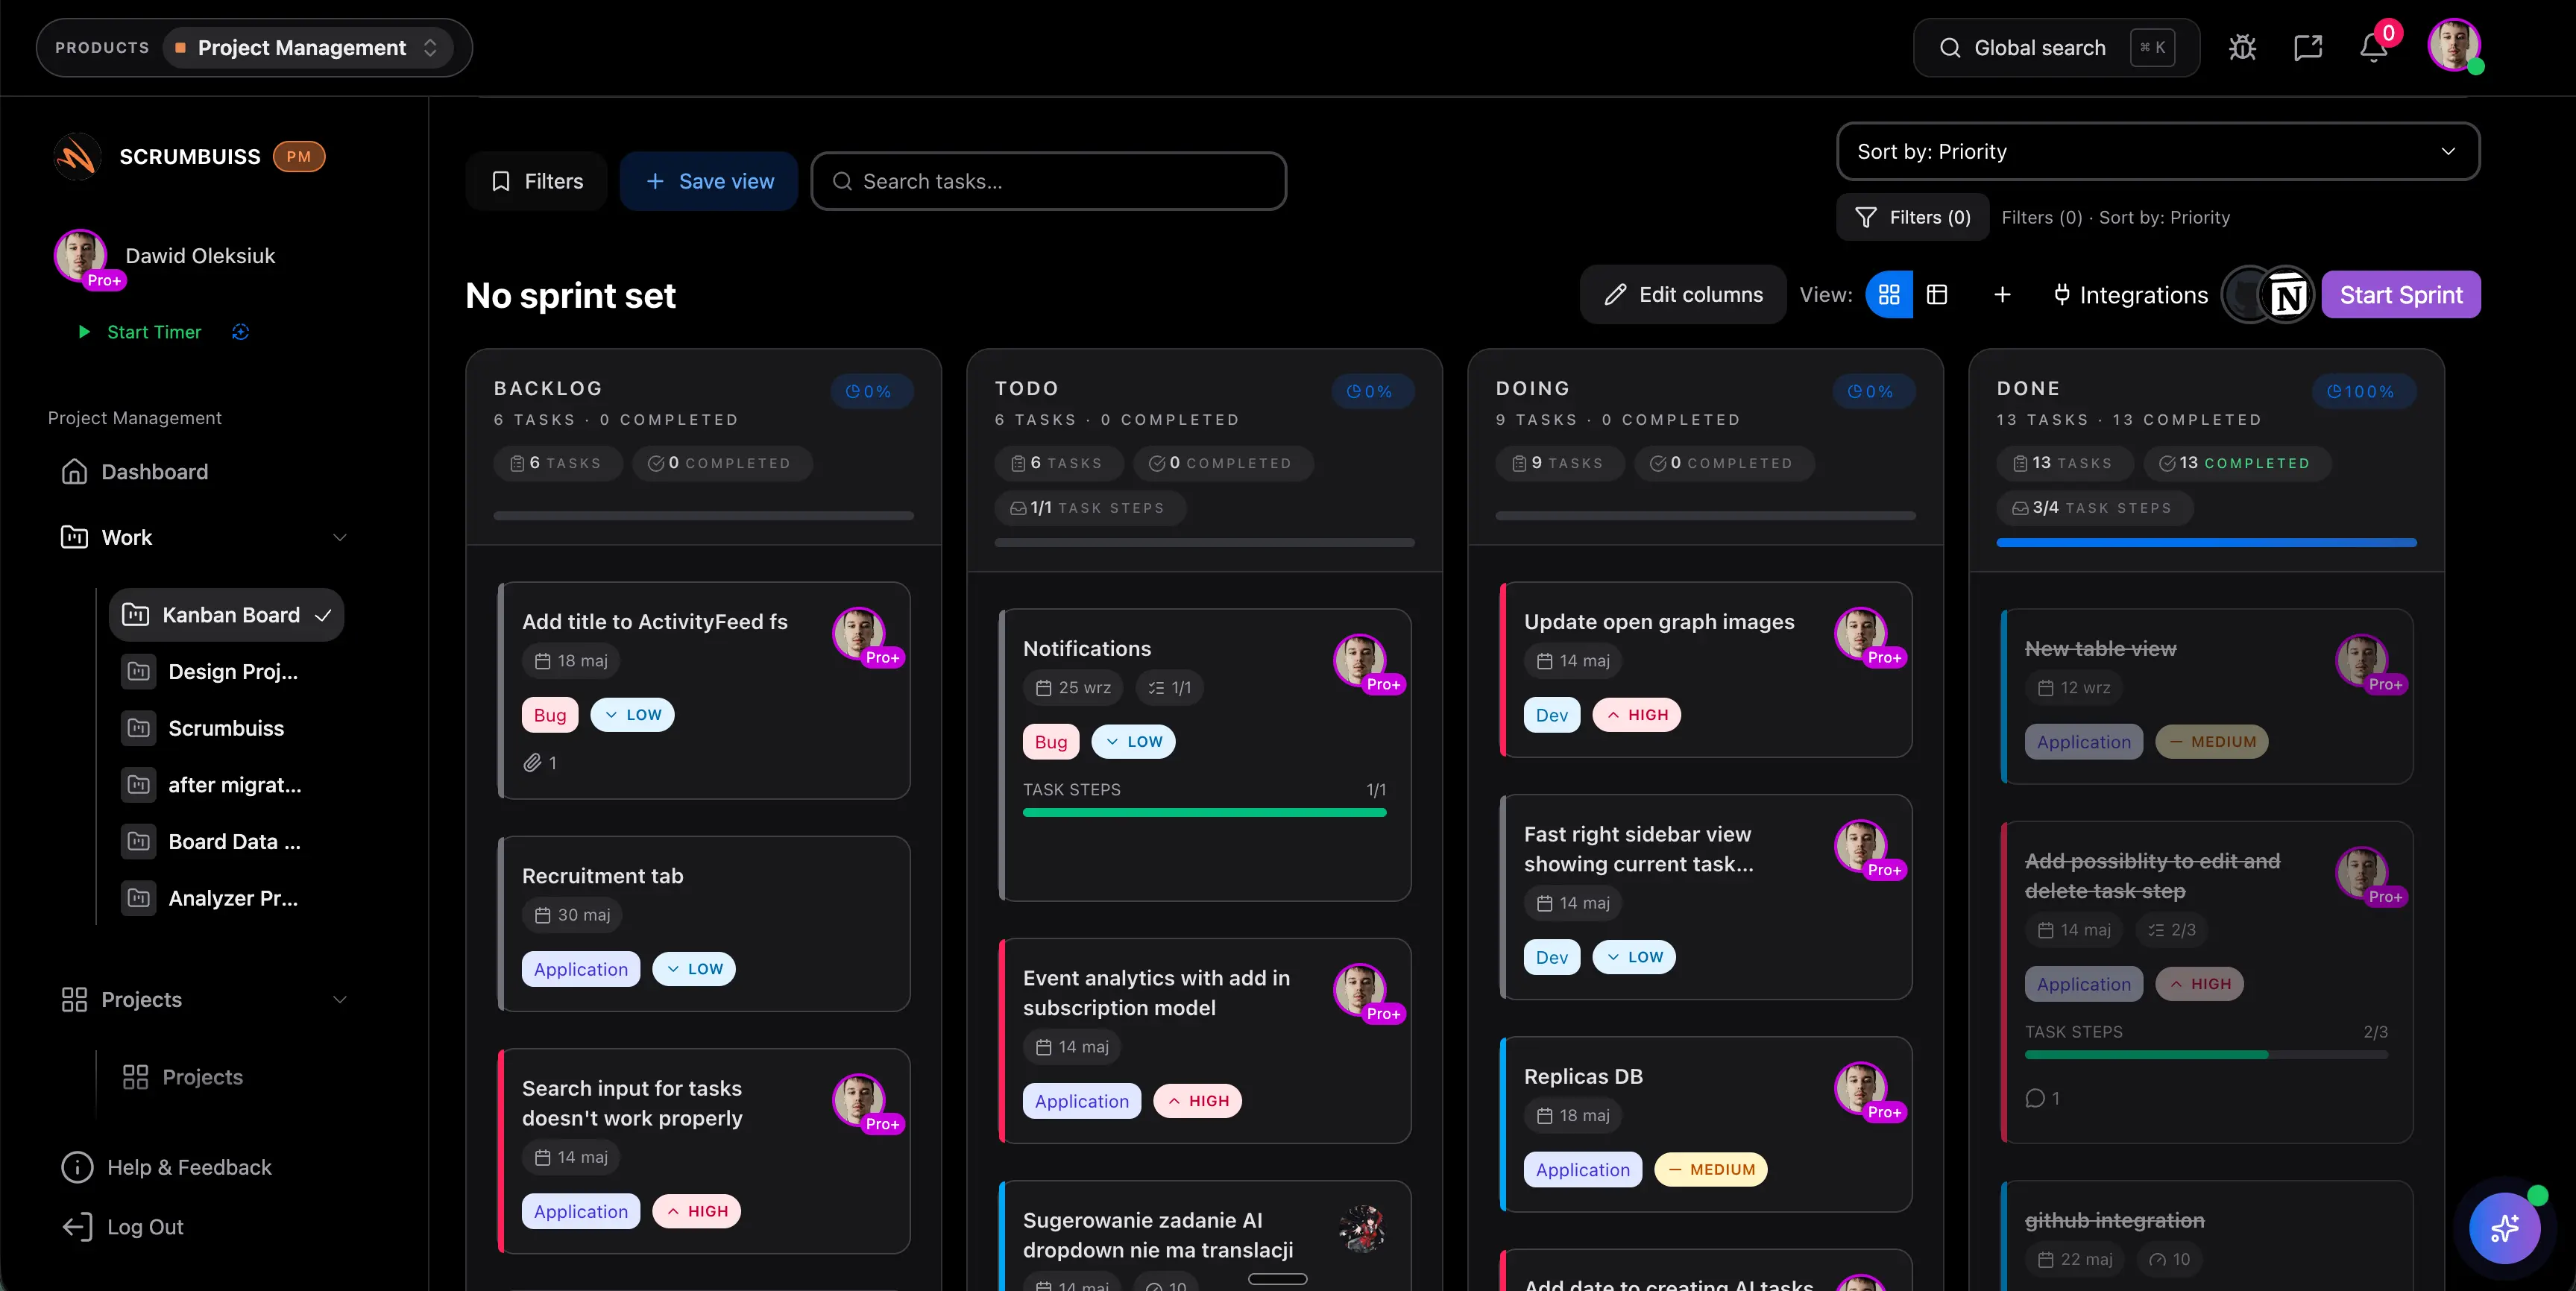
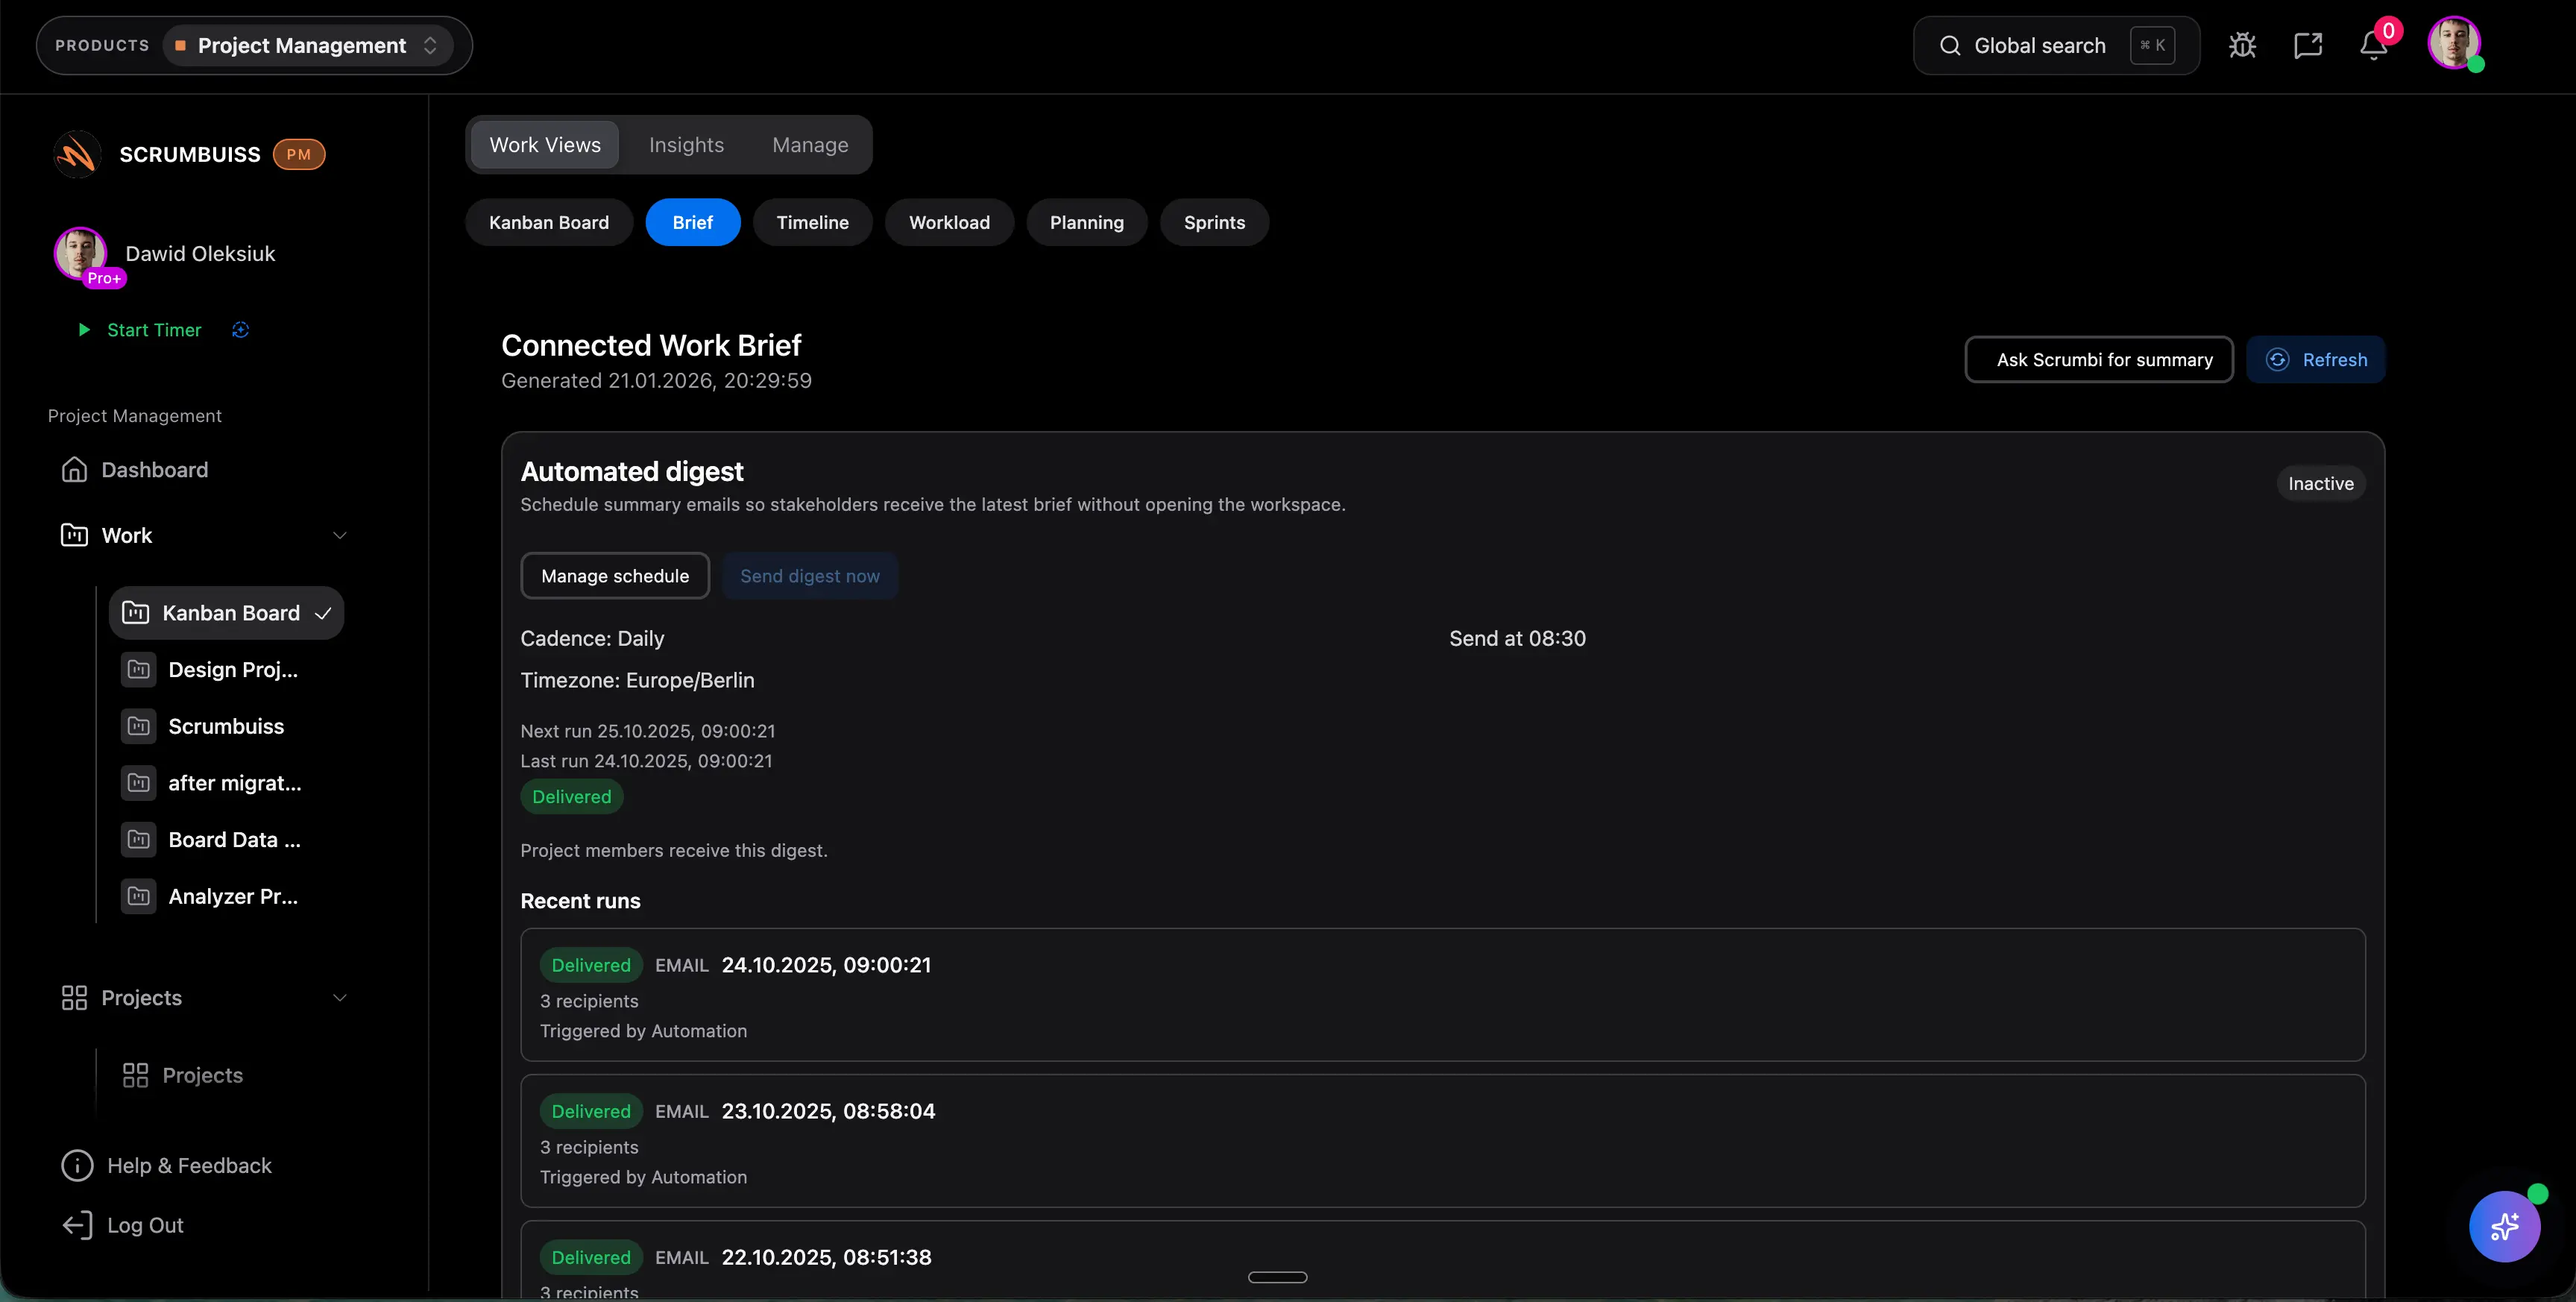
Dashboard guide • reviewed March 15, 2026

Project Management Dashboard Software

Track project progress, blockers, workload, KPIs, and stakeholder-ready updates in one live dashboard so teams can spot delivery drift earlier and explain status without rebuilding the story in spreadsheets and slide decks.

Use this page to compare project-management dashboards before your team standardizes on another spreadsheet rollup, another static executive deck, or another board layer that still has to be translated by hand every week.

Scrumbuiss project dashboard overview

How we reviewed project management dashboard software

Reviewed on March 15, 2026. This page compares one buying question: which project management dashboards help teams monitor active work, spot delivery drift, and prepare stakeholder-ready updates without turning reporting into a separate maintenance workflow.

  • Scrumbuiss references come from the live pricing page plus the Dashboard, KPIs, Project Delivery, Portfolio, Workload & Capacity, and Software Teams pages in this site.
  • Competitor references come from the official dashboard or project-management pages published by monday.com, Asana, and Scoro reviewed on March 15, 2026.
  • The goal is not to count widgets. It is to help teams decide whether a dashboard stays connected to live delivery work, workload, and status conversations once managers start relying on it every week.

When Scrumbuiss is a fit

The right dashboard is not the one with the most charts. It is the one your team can rely on to monitor delivery health and explain status without creating another reporting workflow to maintain.

Strong fit for Scrumbuiss

Best when one dashboard should help the team monitor live delivery health and explain status without maintaining another reporting layer on the side.

  • Weekly reviews should come from live project data rather than a manually rebuilt spreadsheet or slide deck.
  • Leads need one place to see overdue work, blockers, workload pressure, and delivery health across active projects.
  • The shortlist favors readable project reporting with less setup overhead than a board plus custom dashboard stack.

Worth piloting carefully

A live pilot is useful when work already lives in one or more tools, but the dashboard story is still assembled by hand for managers, clients, or leadership.

  • Test one real review cycle with active deadlines, blockers, and owners instead of a demo dataset.
  • The key question is whether Scrumbuiss reduces status-prep time while making delivery drift easier to spot earlier.
  • Validate that project owners and stakeholders trust the dashboard enough to use it in weekly decision-making.

Probably not the best fit

A dedicated BI or broader business-operations layer may fit better when the main requirement is cross-system executive analytics rather than a project dashboard tied closely to delivery work.

  • Your reporting stack already depends on warehouse data, custom BI models, or finance-first dashboards.
  • The project workspace is only one of many data sources and the dashboard does not need to guide day-to-day delivery decisions.
  • The team values broader business reporting, utilization accounting, or deeper PSA controls more than a tighter project operating view.

Build the live view

Roll project health, owners, deadlines, and blockers into one dashboard the team can actually use

Useful project dashboard software should answer the core delivery questions in seconds: what is on track, what is late, what is blocked, and where leadership attention is needed. That only works when the dashboard reflects live work instead of a manually maintained summary.

  • Pull active projects, task status, owners, deadlines, and overdue work into one view that managers can scan quickly.
  • Keep blockers and work at risk visible beside progress so the dashboard supports action, not just observation.
  • Start with the few questions the team asks every week before adding more charts or widgets.
Scrumbuiss project dashboard showing live status, ownership, and progress visibility

Spot drift earlier

Use KPIs, workload, and activity signals to catch delivery drift before the review meeting

The better project dashboards are not passive reporting pages. They combine KPI movement, workload pressure, and recent activity so teams can see what changed, what is slipping, and where intervention is needed before the next status update becomes reactive.

  • Review throughput, overdue items, bottlenecks, and workload pressure in the same operating view.
  • Pair KPI panels with activity signals and notifications so teams see both the number and the reason behind it.
  • Use the dashboard as decision support for replanning, not just a retrospective summary after the week is over.
Scrumbuiss KPI dashboard used to monitor delivery drift and operational health

Report without rebuilding

Turn the dashboard into a weekly stakeholder update instead of another reporting loop

Project reporting gets expensive when managers have to translate live work into a separate story every Friday. A better dashboard keeps enough context close to execution that the same view can support team coordination, leadership updates, and next-step decisions without manual reconstruction.

  • Use live project and KPI context to explain progress, risks, and next steps without exporting data into a separate rollup.
  • Give delivery leads, product partners, and leadership one readable view grounded in the same source data the team maintains every day.
  • Reduce manual status translation so project reviews move faster and decisions happen with fresher information.
Scrumbuiss dashboard notifications and reporting view used for weekly stakeholder updates

Competitor snapshot

These tools all offer dashboard views, but they package project visibility around different operating models. The useful comparison is whether your dashboard stays close to live delivery work or becomes a separate reporting layer to maintain.

Tool Best for Dashboard/reporting angle Main tradeoff Why teams choose Scrumbuiss instead
Scrumbuiss Teams that want project progress, blockers, workload, KPIs, and stakeholder-ready updates in one delivery workspace. Keeps dashboard views close to execution, workload, timeline, and portfolio reporting so weekly reviews can start from live work rather than exported status notes. Buyers should validate the workflow in a live review cycle because Scrumbuiss is newer and less familiar than broader work-management brands. Cuts manual status translation by keeping the reporting layer tied closely to active work and operational signals.
monday.com Teams already standardized on monday.com that want flexible board-based work management with customizable dashboards and multiple widget-based views. monday.com publicly emphasizes customizable widgets, cross-board visibility, and flexible reporting on top of work already organized in monday.com. Highly flexible setups still need careful workspace design to keep dashboard logic, board structure, and stakeholder reporting consistent as operations grow. Scrumbuiss is stronger when teams want a tighter dashboard-to-delivery workflow with less workspace design overhead and clearer project-status storytelling out of the box.
Asana Cross-functional organizations that want project tracking, status updates, and reporting inside a broad collaborative work-management platform. Asana's project-management positioning emphasizes status updates, goals, automations, multiple project views, and reporting across cross-functional work. Teams should validate how readable the dashboard and reporting layer stays once engineering delivery, workload decisions, or multi-project health need more operational structure. Scrumbuiss is stronger when the shortlist prioritizes live delivery visibility, workload context, and stakeholder-ready dashboards around project execution.
Scoro Service businesses and professional-services teams that want dashboards tied to project progress, utilization, budgets, and broader business performance. Scoro publicly frames dashboard software around all-in-one business visibility, project monitoring, utilization, and operational reporting in one system. The broader business-management layer can be heavier than teams need when the main problem is project visibility and weekly delivery reporting inside the project workspace itself. Scrumbuiss is stronger when teams need a project-management dashboard centered on delivery coordination, blockers, workload, and status communication rather than broader PSA operations.

Review current plan limits, dashboard availability, and reporting depth on the vendor pages before you buy. Product names are trademarks of their respective owners.

What to validate in a live dashboard pilot

Use one real weekly review cycle, not a static dashboard demo. The trial should prove whether the dashboard becomes the place the team actually uses to monitor and explain project health.

  1. Step 1

    Pilot one to three active projects or one live delivery program with real deadlines, blockers, and owners.

  2. Step 2

    Write down the weekly questions the dashboard must answer before you build it: what is on track, what is late, what is blocked, and where workload is tight.

  3. Step 3

    Decide which signals matter most up front, such as overdue work, completion pace, bottlenecks, team load, top risks, and next milestones.

  4. Step 4

    Build one dashboard from live project data and confirm the team can move from the summary view into the underlying work without hunting across tools.

  5. Step 5

    Use the same dashboard in one stakeholder or leadership review and compare the prep time against your current spreadsheet or deck process.

  6. Step 6

    Replan one at-risk project or overloaded owner and confirm the dashboard surfaces enough context to guide the decision quickly.

  7. Step 7

    Set go or no-go criteria: less manual reporting, clearer blocker visibility, faster weekly reviews, and more trusted project status.

FAQ

These are the buying and rollout questions teams usually need answered before a project dashboard becomes part of the real operating rhythm.

What should teams look for in project management dashboard software?

Look for dashboard software that stays connected to live work, not just a static reporting layer. The most useful setup shows project progress, overdue work, blockers, workload pressure, and KPI movement in one place, then lets the team drill into the underlying work without rebuilding the story somewhere else.

What is the difference between project dashboard software and a generic BI tool?

A BI tool is usually better for broad cross-system analytics, finance reporting, or warehouse-driven executive dashboards. Project dashboard software is more useful when the main goal is to monitor live delivery work, spot drift quickly, and turn status data into decisions inside the project workflow itself.

When does a project dashboard stop being useful?

Dashboards lose value when they become a second reporting workflow that someone has to maintain manually. If the view is stale, overly customized, or disconnected from the task and project data the team updates every day, leaders stop trusting it and status meetings revert to spreadsheets, chats, and manual summaries.

Can one dashboard work for both delivery teams and stakeholders?

Yes, if the dashboard is built around a shared set of operational questions. Teams usually need a view that shows progress, blockers, and workload, while stakeholders want clarity on health, risks, and next steps. One well-structured dashboard can serve both groups as long as it stays readable and tied to live work.

How should we evaluate dashboard software in a pilot?

Use a live pilot with real projects and one real review cycle. The test should show whether the dashboard reduces status-prep time, makes blockers easier to spot, and gives managers enough confidence to use the same view for delivery decisions and stakeholder reporting.